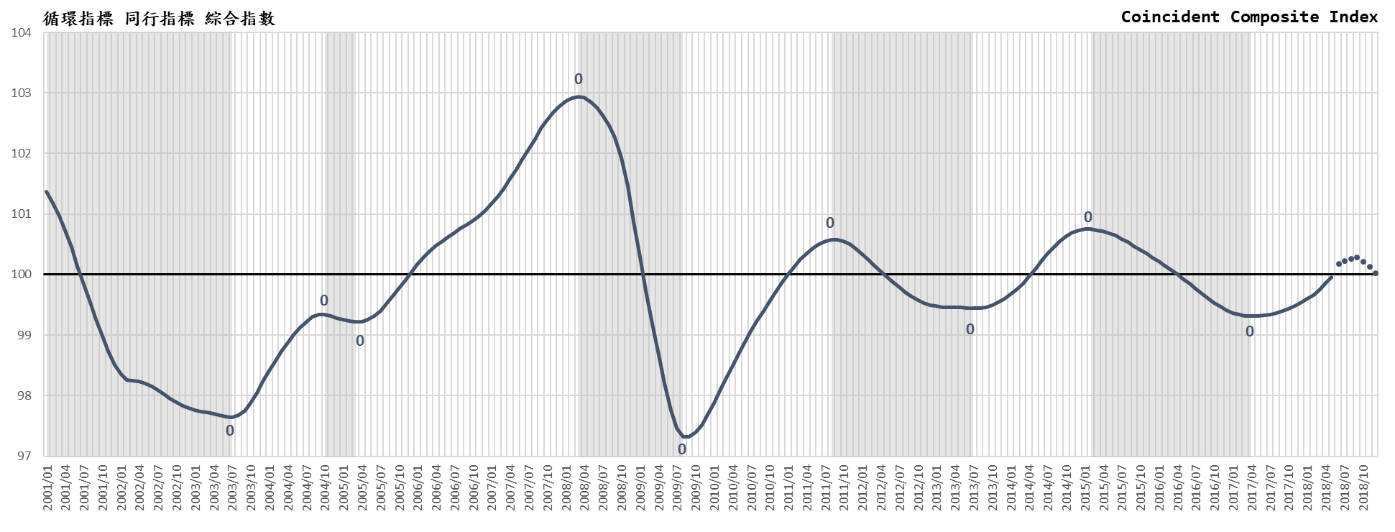
CDRI’s"Taiwan Commercial Service Industry Business Cycle Composite Index" predicts that the service industry in Taiwan will continue to recess for the third month in December. At the end of the year, the risk of recession in the domestic market in the commercial service industry will increase. It is recommended to adopt incentives more precisely to the industries and regions that have been obviously recessing.
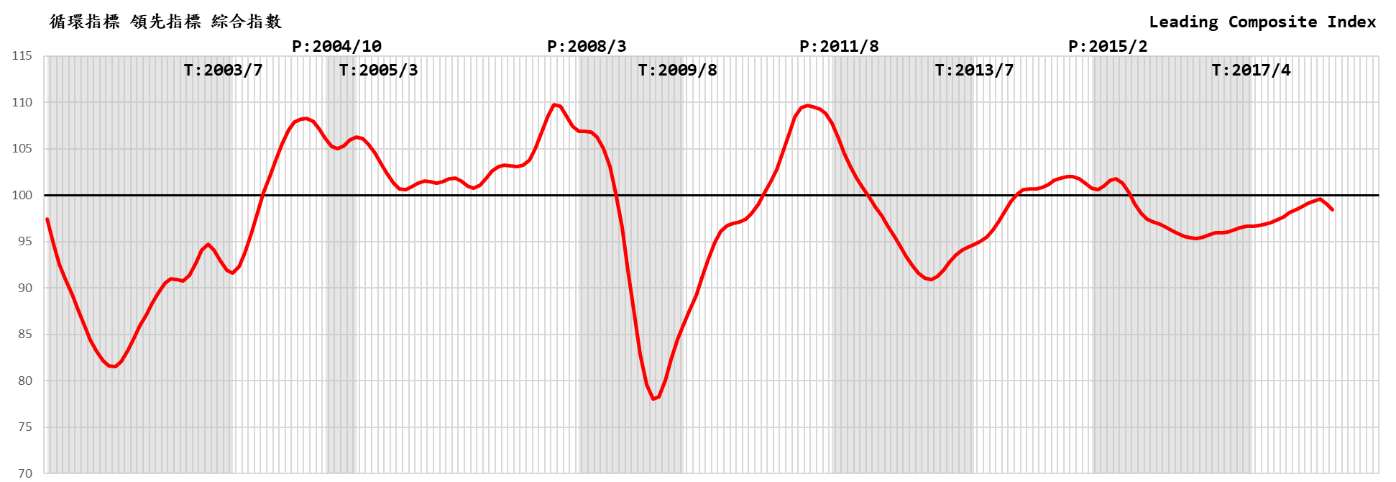
A. Cyclical Leading Composite Index shows a significant downward trend in Q2
The actual value of Cyclical Leading Composite Index for service industries had been declining from April to May. Three monthly data sub-indicators including the number of first time accepted applications for unemployment allowance (inversion) and the net number of employees in the service industry, peaked in January this year. The commercial service stock price index hit the top in April, declined for the first time in May. The other three quarterly data estimated that the second quarter will continue to rise in each month, including the substantial GDP of transportation and storage, the formation of substantial private capital that fell in April this year, and the net trade income of the service industry. The index of the six sub-indicators is continuously going down in April, May and even June (estimated), and the warning signal for the declining is obvious and stable. The coincident composite index which predicts the future economy is likely to decline continuously in October, November, and December this year.
B. Six sub-indicators show poor employment though the investment increases while stock market falls
In the first quarter data from the Directorate -General of Budget, Accounting and Statistics, Executive Yuan, it has been found that three of the six sub-indicators of the leading indicators, including the “Private Real Fixed Capital Formation” cycle index, which continued to decline from January to March, and the “ Initial Recognition of Unemployment Allowance Case (Reciprocal)” cycle index declined in February and March. Also, the "Commercial Services Industry Employment Rate" cycle index decreased in February and March. The insufficiency of investment and employment led to the declining of the coincident composite index which predicted by the leading composite index in October.
In the second quarter, the two sub-indicators representing employment continued to decline in April and May. The rare rising of investment continued in April and May, which is a good sign. Only the service industry stocks declined in May and June. the cycle comprehensive index is forecast to continue to decline until December.
The increase in investment will contribute to the improvement of employment in the future. However, the decline in the stock market of the commercial service industry may affect the willingness of investing for the investors, which should be taken notice of.
The two leading sub-indicators that can directly reflect the employment trends of the future services industry continue to decline this year, which of course has a negative impact on employment and domestic consumption. The employment of Taiwan's service industry is 1.8 times higher than the manufacturing industry. Even if the export-oriented manufacturing industry is booming, the service industry will affect more on employment and consumption.
C. Trends are various in coincident indicators’ sub-indicators in different sectors, affecting the recovery of the composite index
Taiwan's service industry resumed from its recession from May 2017 and recovered in May 2017. The sub-indicators in the coincident indicators (which can synchronously reflect the substantial GDP changes in the service industry), however, different sectors go in different ways.
1. The wholesale and retail industry's substantial GDP cycle index appeared trough in early October 2016. So far, the first quarter (actual value) and the second quarter (predicted value) have continued to rise, but the cycle index has been increasing. Without surpassing its own long-term trend value, its recovery pace is moderately stable. 2016 (recession period) annual growth of 0.72%, 2017 (recovery period) annual growth rate of 3.74%, the first quarter of this year, the annual growth rate was 4.33%.
2. The substantial GDP of the finance and insurance industry is about 42% of the wholesale and retail industry. Its circulation index only appeared in the bottom in June 2017. As of May, the predicted value has exceeded its own long-term trend value, which more fluctuating. In 2016, it grew by 2.3%, and 4.5% in 2017. In the first quarter of this year, it grew by 7.13%.
3. The substantial GDP of the real estate and residential services industry is 17% higher than that of the financial and insurance industry. The cyclical index has fallen all the way since the peak in August 2015. It is the current sub-indicator which has the biggest gap with its long-term trend value. In 2016, the growth rate was 0.8%, and in 2017 it was only 1.1%. The annual growth rate in the first quarter of this year was only 0.96%. It is still declining, and it should be caused by the decline of the “building cycle”.
4. The substantial consumption of residential services, water, power, gas and other fuels was 35 per cent larger than that of the financial and insurance industry, and its circulation index did not appear until the end of December 2017. The growth rate in 2016 and 2017 was 1.6% and 1.2% respectively. It was only in the first quarter of this year that it started to recover with a growth of 6.61%. Most of this sector involves the production and marketing policies of state-owned public utilities, and related measures should be taken to prevent the recession.
5. The cycle index of the number of employees in the service industry has been in the bottom on October 2017, it has turned to the top and then went down in February this year, which is the most unstable sector. The annual growth rates for 2016, 2017 and the first quarter of this year were only 1.37%, 1.70% and 1.81% respectively.
D. Structural transformation is the key to recovery
The purpose of the business cycle indicator is to anticipate the possible turning point of the future cyclical fluctuations. It is hoped that the necessary short-term strategy will be applied as soon as possible, and strengthen the stimulus before the downturn (ie, the peak), and improve the effective demands. On the contrary, to avoid overheating and serious inflation, measures should be taken to suppress the situation in advance.
As the global competition for economic digital transformation is in full swing, the structure of the retail industry is extremely visible. The online trading of e-commerce, m-commerce and traditional physical store trading models are changing both in quantity and quality. eMarketer survey statistics global retail sales totalled 22.64 trillion US dollars in 2017, of which e-commerce accounted for 10.2% and 58.9% of it is composed of mobile commerce. It also predicted that by 2021, global retail e-commerce will increase be from 2.309 trillion US dollars in 2017 to 4.479 trillion US dollars, and the proportion of m-commerce will rise to 72.9%. eMarketer also found that e-commerce in Taiwan accounted for 6 to 7% of total retail sales in 2017, and estimated that the overall retail growth rate in Taiwan between 2018 and 2022 will be less than 1% per year, while e-commerce will grow nearly 7% per year. Growth rate. This change in business technology and business model certainly will become more evident between the traditional retail and new retail, the same amount represents different diffusion effect and the different results caused by different consumer behaviour and industrial development.
(Business Cycle Indicator System is designed, instructed and Analysed by professor Tain-Tsair Hsu)
|
Business Cycle Coincident Composite Index for Taiwan Service Sector
|
Year/Month
|
Cycle Index
(Trend Value=100)
|
Remark
|
|
2018-12
|
100.0308
|
(p)
|
Predicted by Leading indicator in Apr-June 2018
|
|
2018-11
|
100.1415
|
(p)
|
|
|
2018-10
|
100.2263
|
(p)
|
|
|
2018-9
|
100.2996
|
(p)
|
Coincident index composite index predicted by the leading index composite index
|
|
2018-8
|
100.2736
|
(p)
|
|
2018-7
|
100.2353
|
(p)
|
|
2018-6
|
100.1929
|
(f)
|
|
|
2018-5
|
99.9622
|
(f)
|
|
|
2018-4
|
99.8565
|
(f)
|
|
|
2018-3
|
99.7426
|
(a)
|
Coincident composite index actual value
|
|
Source:Business Cycle Forecasting Team, CDRI
|
| |
|
a
|
actual
|
|
|
|
f
|
forecasted
|
|
|
|
p
|
predicted
|
|
|
Business Cycle Composite Index for Taiwan Service Sector
|
Source:Business Cycle Forecasting Team, CDRI
|
Previous Cycle:
|
Cycle
|
Trough
|
Peak
|
Trough
|
|
1
|
2003/7
|
2004/10
|
2005/3
|
|
2
|
2005/3
|
2008/3
|
2009/8
|
|
3
|
2009/8
|
2011/8
|
2013/7
|
|
4
|
2013/7
|
2015/2
|
2017/4
|
|