Commerce Development Research Institute released Business Cycle Coincident Composite Index for Taiwan Service Sector today which shows continuing declination since last May and will slow down again this may after slightly rising in April.
The forecasted composite index of coincident indicators fall all the way down from July and continue to decline in May next year. Although there is a slight rebound in April, the weak signal represents a small oscillation and can not change the downward trend.
Until December of last year, among the six sub-indicators included in the leading indicators, Private Real Fixed Capital Formation is the only one which is rising continually, the remaining sub-indicators are all declining, especially the stock price index of the commercial service industry. On the other hand, however, the private investment seems to be growing because of the expenditure of the government's"5 plus 2" Industrial Innovation Development Program and Forward-Looking Infrastructure Development Program, and the return of investment from Taiwanese companies under the influence of the US-China trade war.
In the past 20 years, Taiwan has weakened the domestic economy due to the relative loss of autonomy during the long-term international economic boom. The private investment has been growing overseas and less domestically, the overall economic structure has become fragile, and the commercial service industry has gone worse. 2019 is a rare opportunity for a turnaround of the crisis. However, the opportunity is a kind of luck which created by people who are capable, prepared, and willing to work hard.
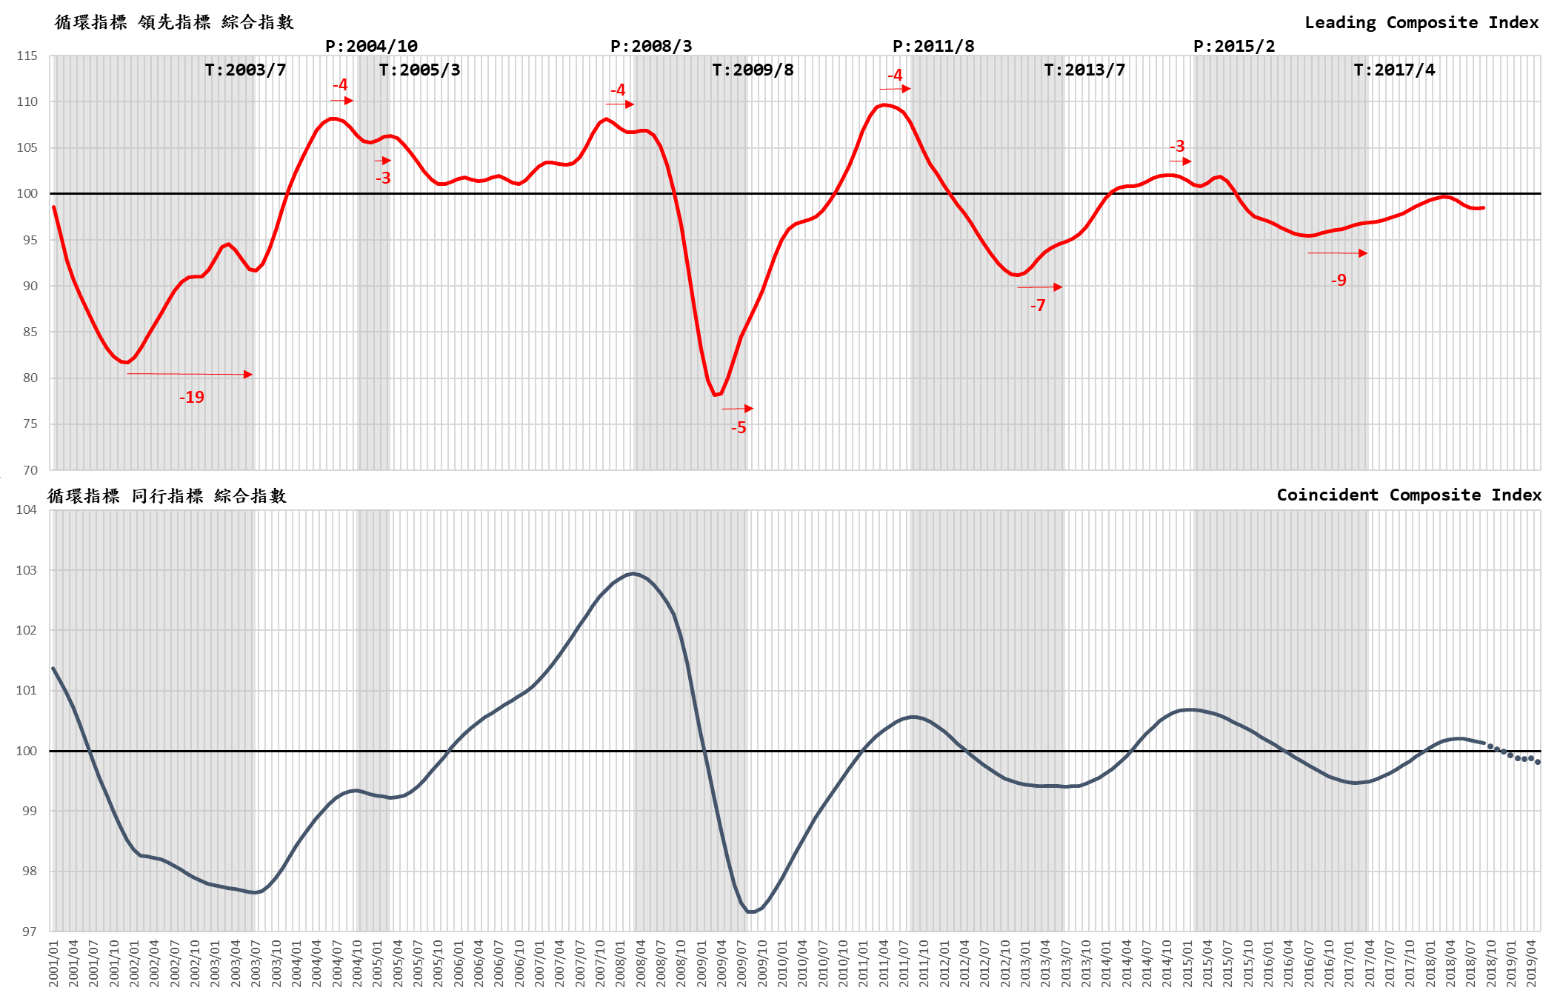
A. The actual value of the leading indicators of the service industry has shown a significant downward trend after hitting the top in March this year. It has dropped by nine months in December (including partial evaluation), and the declination is accelerating.
The peak of the actual value of Cyclical Leading Composite Index for service industries (the cycle value of long-term trend excluded) appeared in March 2018 and then fell all the way. Its cycle index has fallen from 99.68 in March to 98.38 in August and rebounded slightly to 98.47 in September, but it has fallen to 97.48 in December (including partial estimated value), falling back to the level of August 2017.
At the same time, actual cycle value of the composite index of coincident indicators which predicted by Cyclical Leading Composite Index peaked in May 2018 and then dropped to 99.97264 in December 2018, which is predicted to be 99.8102 in May this year, although it slightly rebounded to 99.8755 in April. In May, it fell back to the level of October 2017 (as shown below). The above indicates that the business trend of Taiwan's business services industry is slowing down, and the declination is accelerating.
The trend and strength of the composite index of coincident indicators also show that although the commercial service industry has regained its long-term trend level (100) last year since its recovery in April 2017, it is still not as good as during 2014 and 2015. A variety of economic stimulus measures against the doldrums can be applied. Also, the digital transformation has become popular which improved the industrial structure through supply-side reformation with an adequate theoretical and practical basis. The effect of US-China trade war is also an activator, with the supply-side demand which provides a great opportunity. With our sufficient capital, talents and technology, it is possible to turn peril into safety with effective economic policy and administrative efficiency. 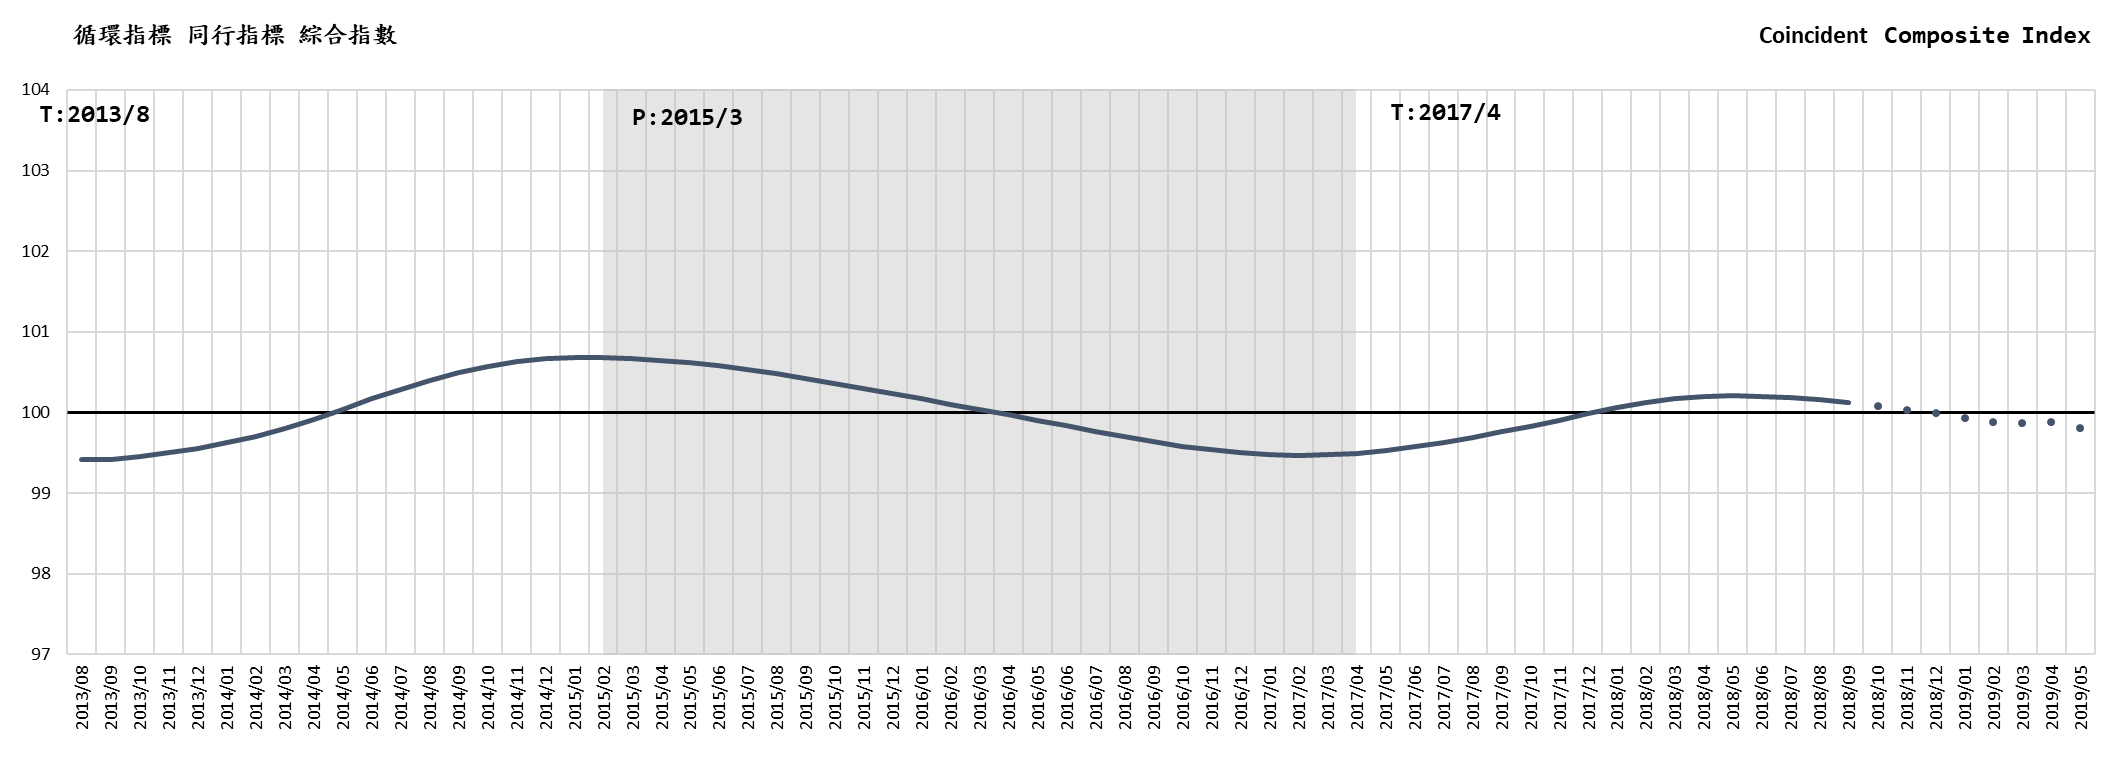
The recent trend of Coincident indicator cycle index
B. The six sub-indicators of the leading indicators are still showing bad employment; stock price index is declining after the October stock market crash, and the service industry trade balance has fallen back to the bottom before the recovery in March 2017. It was discovered that transportation and warehousing are also begun to fall in the second half of 2018, and the declination is quickening; only the Private Real Fixed Capital Formation, which has always been unstable, continued to rise, playing the role of the mainstay. As a result, in the sharp turn of the stock price, the effect of investment is still limited in the short term, leading to the continuous and accelerated declination of the Composite Index of Leading Indicators, but the peak of investment for the “5 plus 2" Industrial Innovation Development Program and Forward-Looking Infrastructure Development Program may turnaround with the backflow of Taiwanese business.
C. Sub-indicators of the coincident index showing the various trends in different sectors, the composite index has continued to decline in June 2018, and the declination in Q4 accelerated.
Taiwan’s service industry resumed its recovery in May 2017 after the recession in March 2015. The actual value shows that the Cycle Coincident Composite Index keep rising till May 2018. However, the actual value began to decline in June, and has dropped to 100.13 in September, has fallen to 99.97 in December (including partial evaluated value). The composite index of coincident indicators predicted by the Composite Index of Leading Indicators will continue to decline as well; it will drop to 99.81 in May this year.
The sub-indicators in the coincident index of the indicator system (which can synchronously reflect the real GDP changes in the service industry), however, see different trends in different sectors.
|
Business Cycle Coincident Composite Index for Taiwan Service Sector
|
Year/Month
|
Cycle Index
(Trend Value=100)
|
Remark
|
|
2019-05
|
99.8102
|
(p)
|
(P): Predicted by leading indicator from October to December 2018
|
|
2019-04
|
99.8755
|
(p)
|
|
2019-03
|
99.8636
|
(p)
|
|
2019-02
|
99.8776
|
(f)
|
Forecast based on the actual value of the Composite Index of Leading Indicators
|
|
2019-01
|
99.9271
|
(f)
|
|
2018-12
|
99.9865
|
(f)
|
|
2018-11
|
100.0261
|
(f)
|
|
2018-10
|
100.0774
|
(f)
|
|
2018-09
|
100.1282
|
(a)
|
Actual value of the Cycle Coincident Composite Index
|
|
2018-08
|
100.1588
|
(a)
|
|
Source:Business Cycle Forecasting Team, CDRI
|
| |
|
a
|
(actual)
|
|
|
|
f
|
(forecasted)
|
|
|
|
p
|
(predicted)
|
|
Business Cycle Composite Index for Taiwan Service Sector
Source:Business Cycle Forecasting Team, CDRI
Previous cycle:
|
Cycle
|
Trough
|
Peak
|
Trough
|
|
1
|
2003/7
|
2004/10
|
2005/3
|
|
2
|
2005/3
|
2008/3
|
2009/8
|
|
3
|
2009/8
|
2011/8
|
2013/7
|
|
4
|
2013/7
|
2015/2
|
2017/4
|