Commerce Development Research Institute released the additional version of Business Cycle Coincident Composite Index for Taiwan Service Sector, since it hit the top in May last year, it is expected to decline for 11 months, and it will rise slightly in May this year but will fall again in June, this means that the Taiwan service industry will continue to rise in the investment sector, and the employment sector may gradually rise from the bottom , and the real service sector will continue to rebound. The main reason is that the Directorate-General of Budget, Accounting and Statistics released a new estimate of the actual value in Q4 last year to compare the original valuation, and found that the overall cycle index level moved up, but the downward trend unstable.
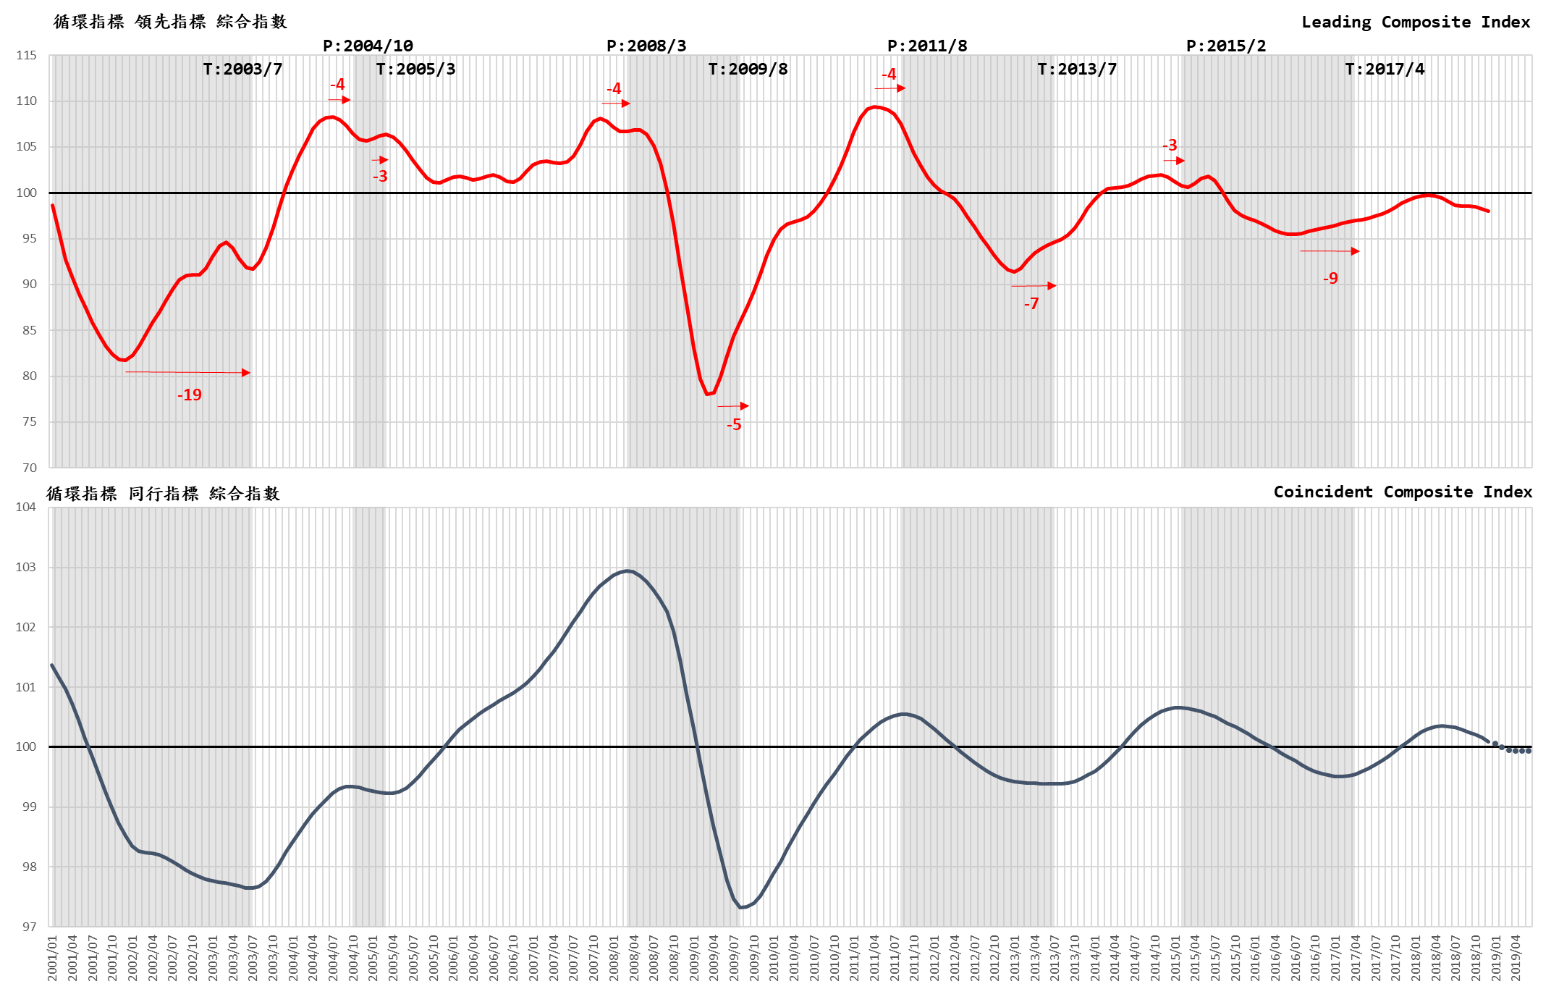
We use the leading indicator cycle index to predict the future trend of the coincident index.
The Leading Indicators Cycle Composite Index hit its peak in March last year and then rebounded in September after a five-month decline. According to the original estimate in Q4 last year, the year-on-month can rise steadily for five months. However, the actual value of the Q4 of last year made the system calculate the leading indicator cycle comprehensive index from October last year to a continuous decline, the coincident index composite index representing the actual economic changes from the top last May and then down 11 After the month, it will fall again in June after a slight increase in May this year. According to this trend, the economy will not make a turnaround in the short term.
The actual value of the leading indicators of the service industry showed a declining trend after hitting the top in March last year, only the sub-indicators of the employment sector-- the actual value of initial recognition of unemployment benefits in December greatly improved for two consecutive months. The improvement is changing the comprehensive index, plus in Q4 last year, some indicators were showing positive signs, and the leading index cycle composite index continued to increase slightly from September. However, the actual value of these sub-indicators in Q4 last year turned significantly down to the leading index composite index. It has continued to decline since October.
The actual value of Cyclical Leading Composite Index for service industries ( Cycle value of long-term trend excluded) in March 2018 peaked and then fell, its cycle index has fallen from 99.77 in March to 98.54 in August, and rebounded to 98.58 in September, but has turned down again since October, to 98.03 in December. The above means that the Coincident indicators that representing GDP will fall again.
the actual value of the comprehensive index of coincident indicators peaked at 100.36 in May 2018 and then dropped to 100.05 in January 2019. It is predicted to return to 99.94 in May this year and 99.93 in June, and return to the level of October 2017 (As shown below) are below the level of 2018 that barely exceeds the long-term trend. The overall service industry will continue to slow down. The government's stimulus measures should be continually strengthened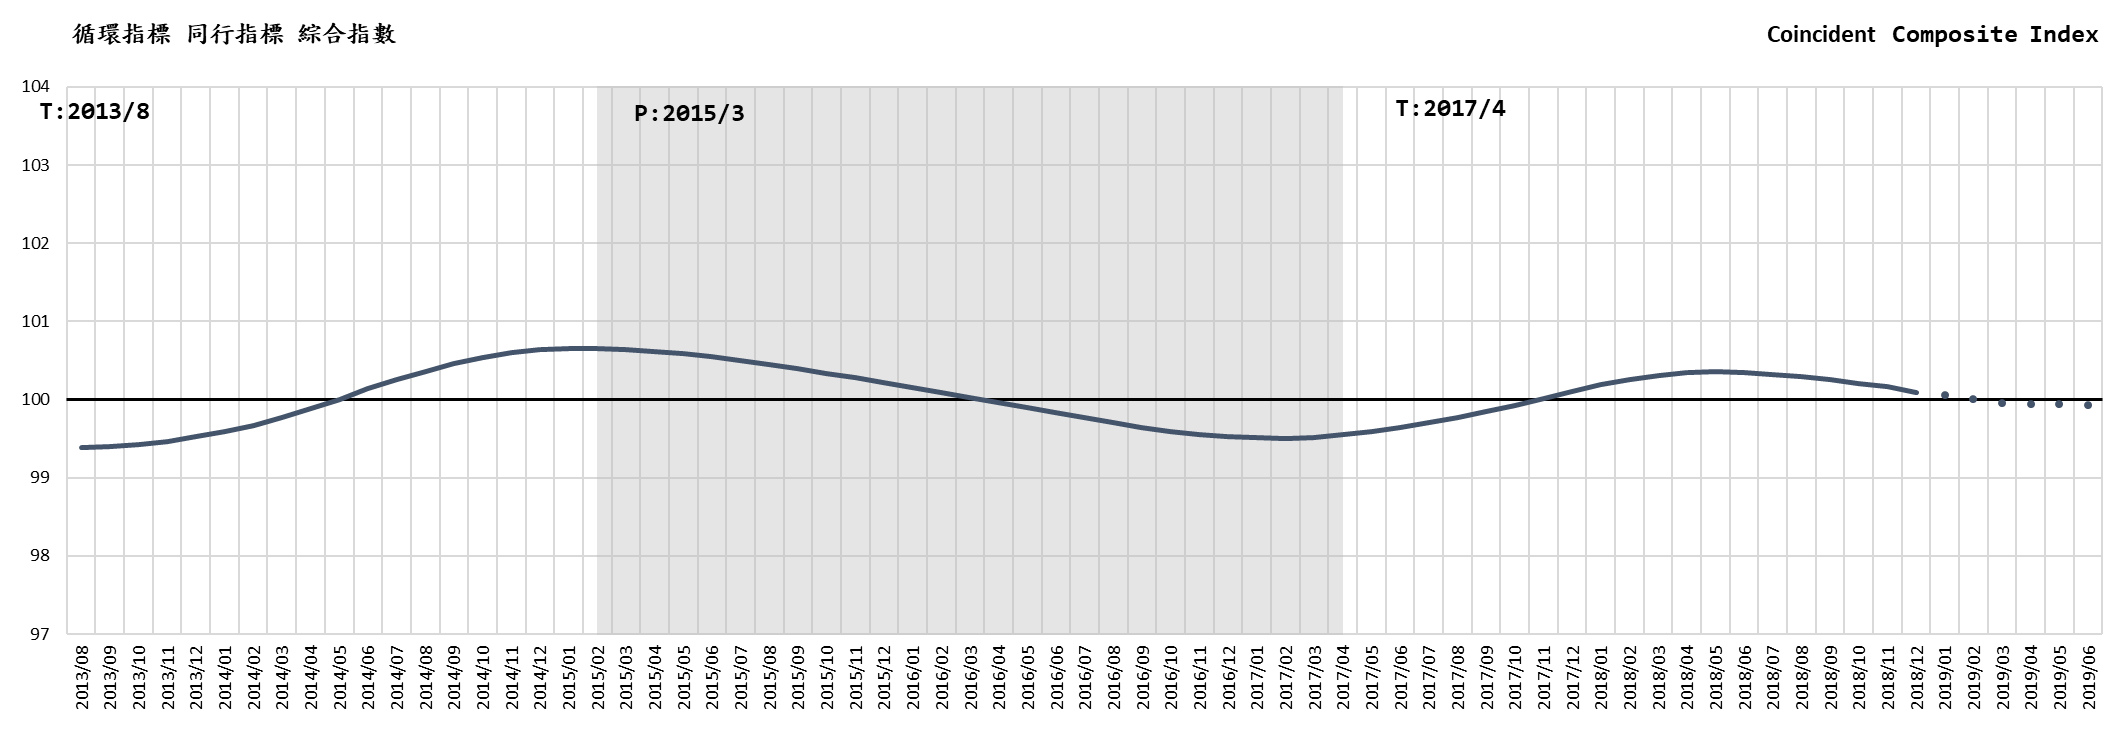
The recent trend of the Coincident Composite Index
The trend of sub-indicators of the coincident indicators vary across different sectors, the composite index has continued to decline in June 2018, and the rate of decline accelerated in Q4. The Directorate-General of Budget, Accounting and Statistics issued the actual value of Q4 last year, which caused the system's coincident index cycle composite index to continue to decline, and the rate of slowdown accelerated. It is predicted that it will fall back to the level of January 2017 in April this year. The cycle trend index dropped lower than the long-term trend (100) for the first time in March this year, which was 99.95. It slightly rises higher in May than that in April but will be reduced to 99.93 in June, indicating that the current slowdown is hard to make a turnaround.
The Taiwan service industry resumed its March 2015 recession and recovered in March 2017. The actual value of cycle index hit its peak in May 2018. However, then the actual value began to decline in June and has fallen to 100.09 in December.
The sub-indicators in the coincident indicators of the indicator system (which reflects the real GDP changes in the service industry), shows different trends in different sectors.
Business Cycle Coincident Composite Index for Taiwan Service Sector
|
Year/Month
|
Cycle Index
(Trend Value=100)
|
Remark
|
|
2019-06
|
99.93
|
(p)
|
(P): Predicted by the leading indicator in January 2019
|
|
2019-05
|
99.94
|
(f)
|
Forecast based on the actual value of the Composite Index of Leading Indicators
|
|
2019-04
|
99.94
|
(f)
|
|
2019-03
|
99.95
|
(f)
|
|
2019-02
|
100.00
|
(f)
|
|
2019-01
|
100.05
|
(f)
|
|
2018-12
|
100.09
|
(a)
|
The actual value of the Cycle Coincident Composite Index
|
|
2018-11
|
100.16
|
(a)
|
|
2018-10
|
100.21
|
(a)
|
|
2018-09
|
100.25
|
(a)
|
|
Source: Business Cycle Forecasting Team, CDRI
|
| |
|
a
|
(actual)
|
|
|
|
f
|
(forecasted)
|
|
|
|
p
|
(predicted)
|
|
Business Cycle Composite Index for Taiwan Service Sector
Source:Business Cycle Forecasting Team, CDRI
Previous Cycles:
|
|
Cycle
|
Trough
|
Peak
|
Trough
|
|
1
|
2003/7
|
2004/10
|
2005/3
|
|
2
|
2005/3
|
2008/3
|
2009/8
|
|
3
|
2009/8
|
2011/8
|
2013/7
|
|
4
|
2013/7
|
2015/2
|
2017/4
|
|
(Business Cycle Indicator System is designed, instructed and analysed by professor Tain-Tsair Hsu)