CDRI released the Business Cycle Coincident Composite Index for Taiwan Service Sector today. It is predicted that it will continue to decline in November this year. However, there are apparent ups and downs between the sub-indicators. It also indicates that the structure between different sectors is undergoing drastic changes. In order to avoid the recession, in addition to the creation of effective demand, the upgrading of industrial structure and the digital transformation of enterprises are necessary.
The substantial GD cycle index of service sector began to decline in the second quarter of last year, also the business cycle composite index of the system. Comparing to the past cycles, the sign of recovery is weak, and the peak is the lowest. That means there are distinct structural factors involved, not only short-term effective demand shortage or the declination of competitiveness, but also the changes in consumer behavior, market and industrial structure changes. The digital transformation competition of enterprises in the world is becoming more and more fierce. The speed of transformation not only determines the international competitiveness of its industry but also determines whether the productivity of a country can be effectively improved. The transformation has made an impact on the traditional sectors and SMEs; they are facing the pressure of market shrinking. This is a destructive innovation which is challenging to the Taiwanese SMEs, in the new era of digital economy with smart Internet of Things and business model, yet the SMEs have their advantages of decentralized latitude, creativity, flexibility, and tenacity.
The recent trend of Coincident indicator cycle index
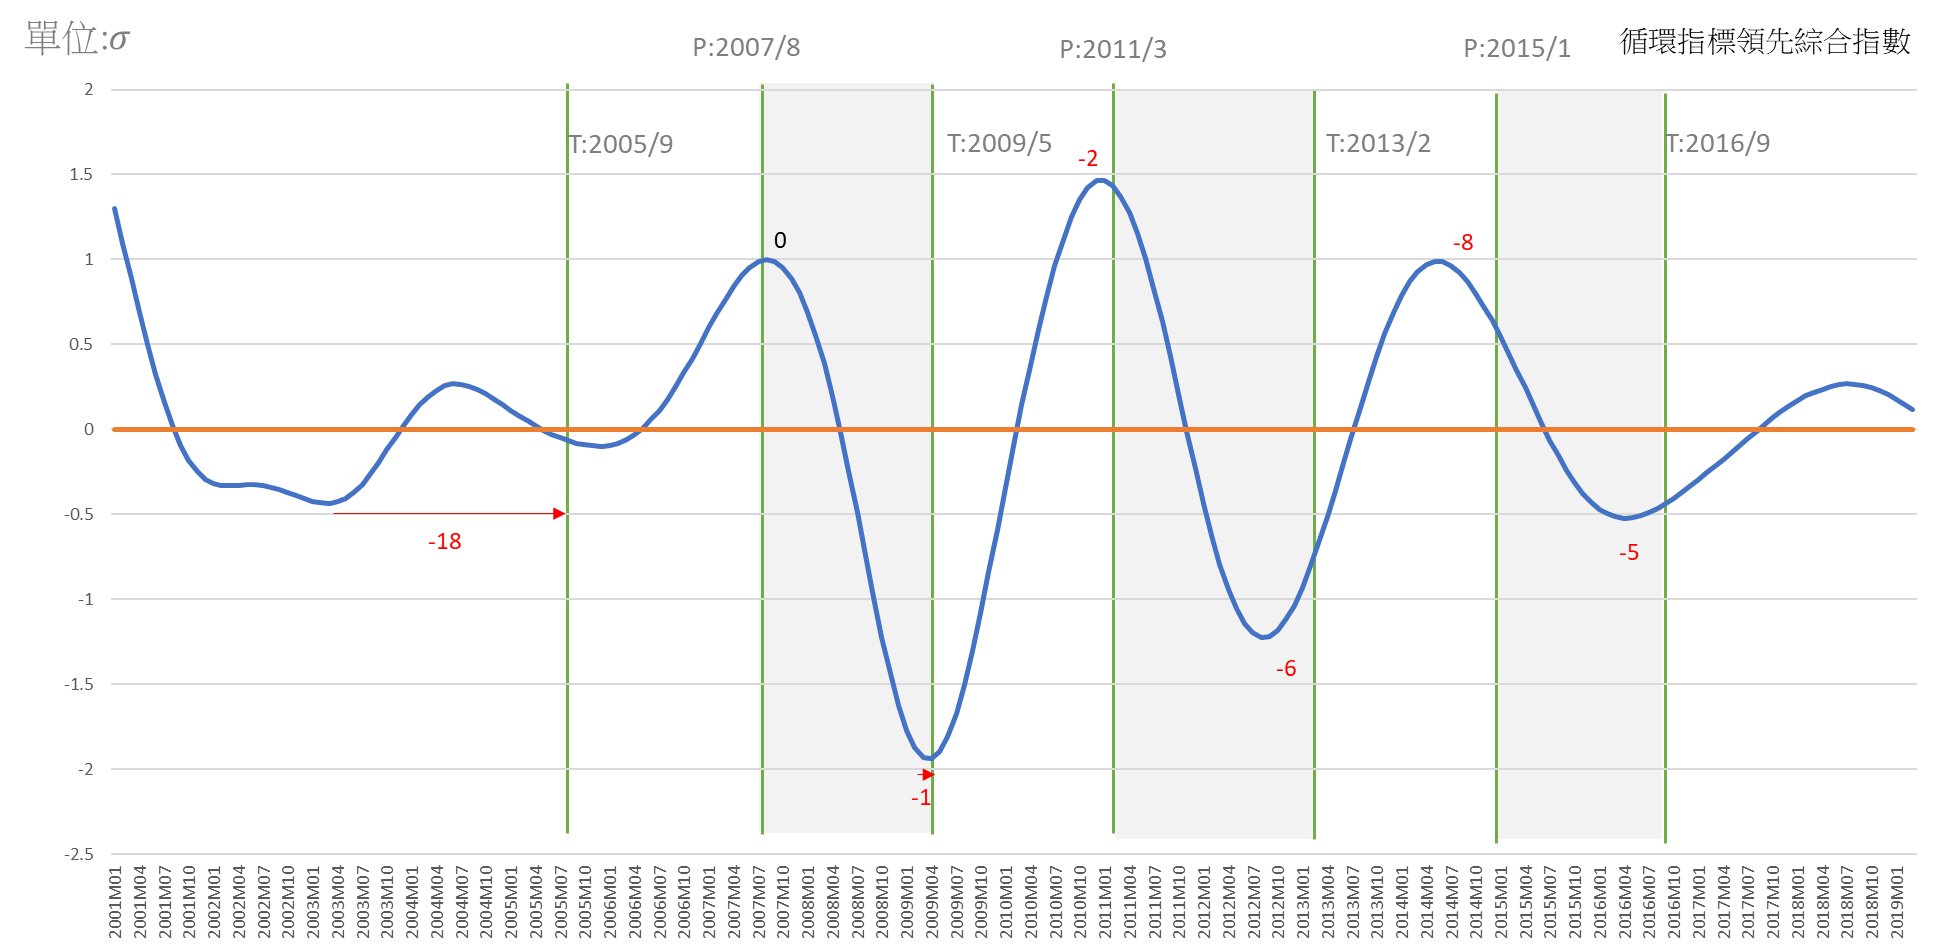
A. The actual value of Cyclical Leading Composite Index for Service Industries(Long-term trend excluded peaked)in July 2018, and then decline till this May. Although the rate of decline is slower (0.22 standard deciation) than the previous cycle (the peak of the last cycle was in April 2014, followed by the same 10-month drop of 0.64 standard deviation) Among the current six sub-indicators, the downward fluctuations include the real GDP of transportation and storage, the number of initial recognition of unemployment benefits (reciprocal), the net entry rate of employees in commercial services, and the stock index of commercial services. There are two changes in the private real fixed capital formation and service trade income. However, the speed of the composite index has accelerated since the first quarter of this year, indicating that it will be difficult to s rebound if the stimulus measures do not continue to be strengthened.
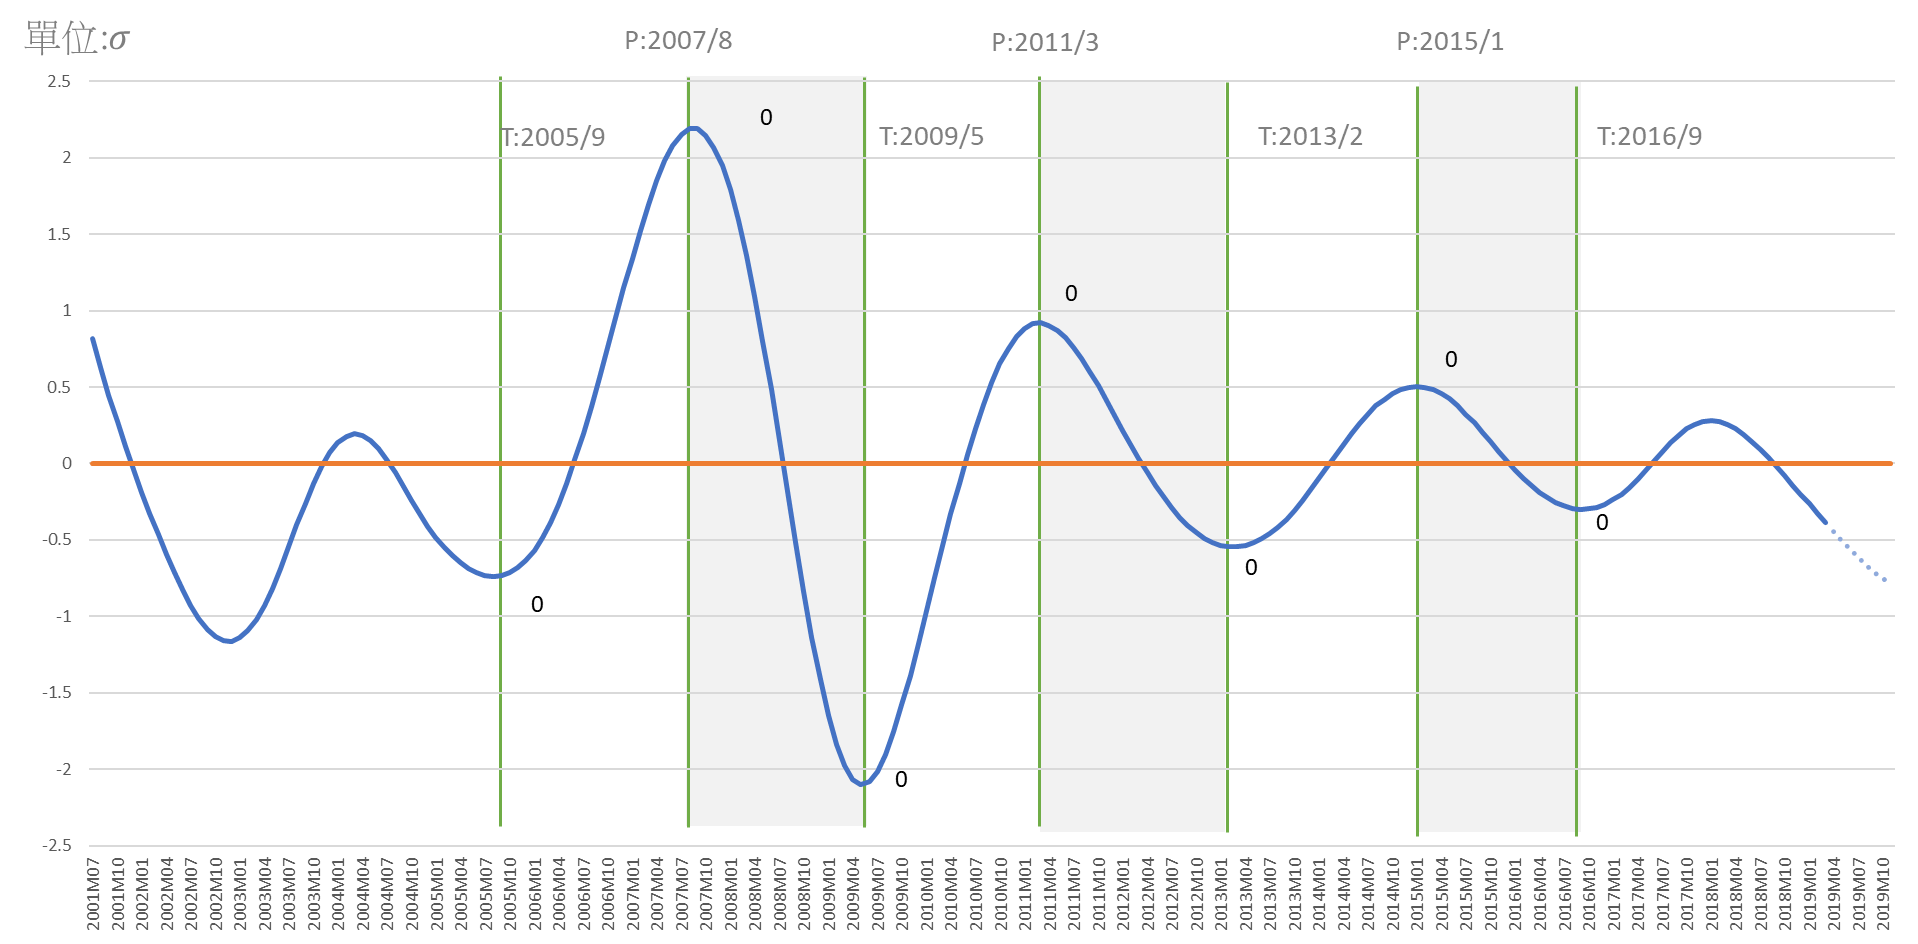
B. The sub-indicators of the coincident index has various trends in different sectors; the composite index has continued to decline in 2018, and the rate of the slowdown accelerated slightly in Q4. The change in the standardized composite index is expressed in unit standard deviation. From the peak of 0.28 standard deviation (S) at the beginning of last year, it fell to a negative 0.02 standard deviation (S) in September last year and will fall to negative 0.38 in March this year (2019), and to negative 0.5 standard deviation in May, negative 0.78 standard deviation in November. It shows that the economy continues to decline, although the downward speed has gradually slowed down.
Business Cycle Coincident Composite Index for Taiwan Service Sector
|
|
Year/Month
|
Standardized Cycle Index
(Unit: ,Benchmark:0) ,Benchmark:0)
|
Remark
|
|
2019-11
|
-0.7803
|
(p)
|
|
|
2019-10
|
-0.7504
|
(p)
|
Forecast based on the lead effect for six months of the ARMA Model:(4,0)(0,0)
|
|
2019-09
|
-0.7121
|
(p)
|
|
2019-08
|
-0.6668
|
(p)
|
|
2019-07
|
-0.6161
|
(p)
|
|
2019-06
|
-0.5614
|
(p)
|
|
2019-05
|
-0.5039
|
(f)
|
Predicted value of the coincident composite index
|
|
2019-04
|
-0.4447
|
(f)
|
|
2019-03
|
-0.3848
|
(a)
|
The actual value of the coincident composite Index
|
|
2019-02
|
-0.3246
|
(a)
|
|
Source: Business Cycle Forecasting Team, CDRI
|
|
(a) actual
(f) forecasted
(p) predicted
|
|
Business Cycle Composite Index for Taiwan Service Sector
Source: Business Cycle Forecasting Team, CDRI
|
|
Cycle
|
Trough
|
Peak
|
Trough
|
|
1
|
2005/9
|
2007/8
|
2009/5
|
|
2
|
2009/5
|
2011/3
|
2013/2
|
|
3
|
2013/2
|
2015/1
|
2016/9
|
|
(Business Cycle Indicator System is designed, instructed and analysed by professor Tain-Tsair Hsu)