After the revision of Commerce Service Industry Index by CDRI, today (5th) the latest analysis and prediction has been released. The Business Cycle Forecast Team points out that the business in Service Industry in Taiwan will continue to grow slowly until July this year.
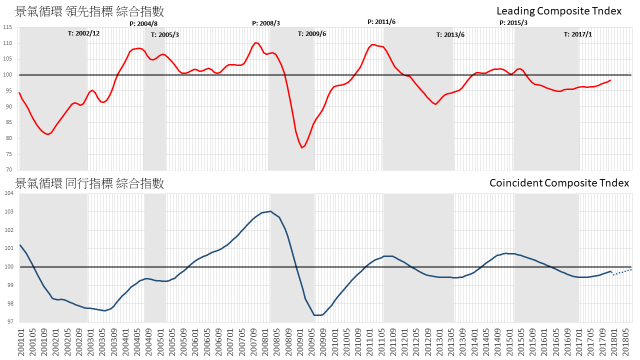
Business Cycle Forecast Team of CDRI stated that the “leading indicators composite index” of the business cycle of service industry in Taiwan compiled by the U.S. National Bureau of Economic Research (NBER) S&T Index has been confirmed that the “Coincident Indicators” which can show the overall outlook of the business services industry will grow from 99.77 points last December to 99.85points this July. The monthly cycle indices of the various months are listed below. Sub-indicators of the six Leading Indicators, five Coincident Indicators and four Lagging Indicators are also provided. The following figures show the trends and amplitudes of the Leading Composite Index and the Coincident Comprehensive Index since January 2001.
The “cycle index” (ie, the percentage of the cyclic value in the time series analysis to the long-term trend value) can show the fluctuation of the cycle. As shown in the following figure, comparing the previous recovery process, we find that the financial crisis in 2008 drastically reduced the Coincident Indicator Cycle Index to 97.39 in June 2009, and then climbed quickly. After 18 months, it returned to a normal point of 100, the average monthly increase of 0.145 is a typical V-shaped recovery. In the other months of March 2005 (99.22) and June 2013 (99.42), began to recover from the trough. The average monthly increase rate of the index were 0.0975 and 0.058 respectively. But this time the bottom point was 99.44 in January 2017, which was the slightest degree of recession. However, the recovery was extremely slow. Its actual value lasted for 11 months till December last year, with an average monthly increase of only 0.03.
What is worth noting is that the forecasts and the estimated figure have only reached 99.85 over the past 18 months till July this year, with an average increase of only 0.0228 per month. This indicates that the pace of upward adjustments has gradually become slower before the normal trend level can be restored. This is a “low-level equilibrium” phenomenon after the financial crisis and the overall economic structure has not really recovered. We must be high alerted and do our due diligence on the possible trends in the second half of the year.
Business Cycle Composite Index for Taiwan Service Sector
|
Year/Month
|
Cycle Index
(Trend Value=100)
|
Remark
|
|
2018-7
|
99.85
|
(p)
|
Extrapolated from Leading Indicators Jan 2018
|
|
2018-6
|
99.82
|
(f)
|
Coincident Indicators Composite Index predicted by Leading Indicator Composite Index
|
|
2018-5
|
99.77
|
(f)
|
|
2018-4
|
99.73
|
(f)
|
|
2018-3
|
99.68
|
(f)
|
|
2018-2
|
99.63
|
(f)
|
|
2018-1
|
99.58
|
(f)
|
|
2017-12
|
99.77
|
(a)
|
Actual value of Coincident Indicators Composite Index
|
|
2017-11
|
99.71
|
(a)
|
|
2017-10
|
99.65
|
(a)
|
Business Cycle Composite Index for Taiwan Service Sector
|
Cycle
|
Trough
|
Peak
|
Trough
|
|
1
|
2002/12
|
2004/8
|
2005/3
|
|
2
|
2005/3
|
2008/3
|
2009/6
|
|
3
|
2009/6
|
2011/6
|
2013/6
|
|
4
|
2013/6
|
2015/3
|
2017/1
|