CDRI’s “Business Cycle Composite Index for Taiwan Service Industry” shows Taiwan’s Service Sector recession from October will continue in November and keep declining till the end of the year. The Business Cycle Leading Composite Indicator falls for the first time after the recovery in April (actual value). Which means the risk of recession at the end of the year is rising, proper action should be taken.
The recession will have the lowest peak with fastest declination if it come true at end of the year, which should be taken seriously.
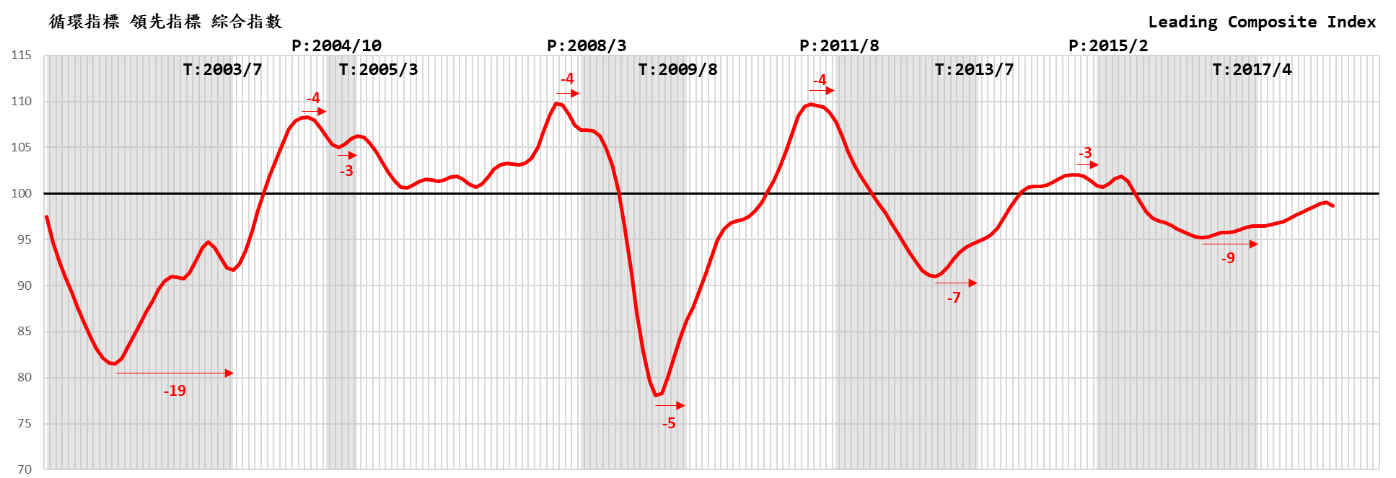
CDRI Business Cycle Forecasting Team pointed out that the “Leading Composite Index” which compiled base on the Business Composite Index by NBER, United States, which has been confirmed to represent the overall trend of the commercial services industry, is based on the forecast of the "Leading Composite Index" which shows result seven-month ahead. It starts to decline in October and continue in November.
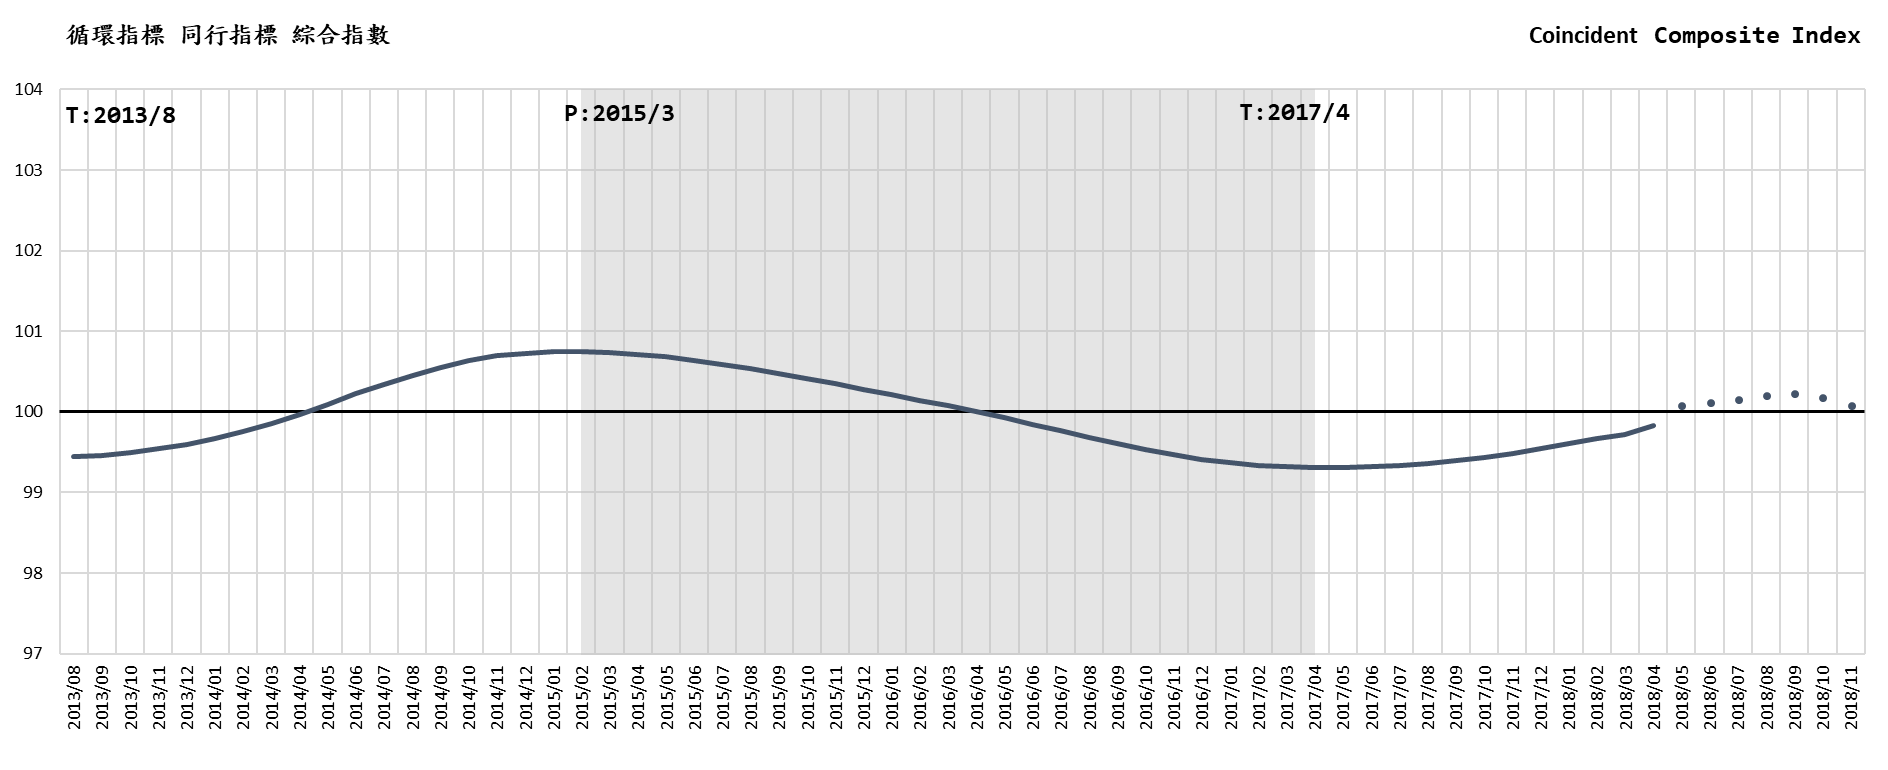
Although the cycle index 100.0842 which exceeding the long-term trend value of 100, however, the average decline in the forecast for two months (-0.07235) is larger than the average increase in the previous four months (+0.0368). If the forecast of the recession at the end of the year unfortunately comes true, this time the peak will be the shortest and the declination fastest comparing the peaks of the previous three cycles and the rate of decline in the two months after the start of the decline.
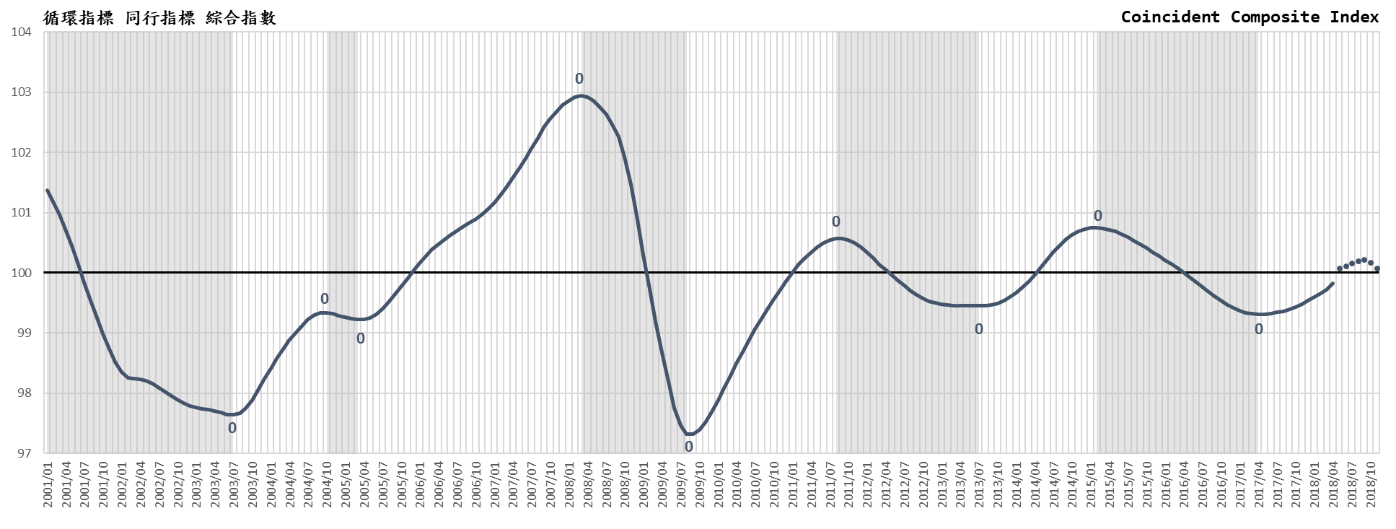
Assuming that September 2018 is the future peak, and the predicted cyclic trend value is 100.2289, which is lower than 102.9422 in 2008/3 (financial crisis), 100.5734 in 2011/8, and 100.7482 in 2015/2. Then compare the average decline of the recession for two months, this time -0.07235 will also be stronger than the above recession: -0.0411 in 2008/3, -0.01365 in 2011/8, and -0.0168 in 2015/2
The fast growing and overheated economy in the long run is prone to a sudden and plunging recession, usually a crisis of excessive inflation (such as technology bubbles or asset bubbles). The generally mild and slow recovery follows the recession milder unless the recovery was in particularly long. However, in terms of the business cycle structure, the short-term "commercial cycle" (small cycle) is met with other periods with a longer recession of business cycle, such as "fixed investment cycle", "building cycle", "foundation cycle" and the "50-year cycle" related to the industrial or institutional revolution, there will be a rapid decline with the inability of recovery.
In short, if the short-wave cycle is in the "down period" of the long-wave cycle, the recovery period of the short-wave cycle will be shorter and weaker than its own recovery period, but the recession will be longer than the past recession. This is an issue worth of further study. In the "50-year cycle" study of the world economy, the 2008 financial crisis is the "down period" of the fifth cycle. Ten years later, 2018 is at the end of the decline period. Now the "old economy" is unbalanced, and the collapse of the old order is accelerating; the prospect of the "new economy" is vying for great but full of uncertainty and fluctuating. Although various long-wave cycles are subject to another special study, it is worthwhile for us to look for possible traces of other long-wave cycles in Taiwan from the behavior of relevant sub-indicators of this indicator system.
Three of the six sub-indicators of leading indicators showing recession
In April the system's leading cycle index started to decline, which ended the rising since 2016/7, three of the six sub-indicators followed the pattern.
1.The circular index of "People's Substantial Fixed Capital Formation" was the first to drive the recovery in 2016/7, but it only fell in 2017/4 in 10 months, and all the way down to March this year. Then there was a good sign of rise in April, hoping to continue and become an important force to stop the declination. "Fixed investment" has its own cycle type, also known as "main cycle", and the period length is usually twice that of a small cycle. Taiwanese government's current promotion of "5+2" and the move to new economic strategies such as Asia and Silicon Valley will help promote the fixed investment. It is advisable to impose incentives for the implementation of the promotion.
2.The index of “The number of cases of initial recognition of unemployment benefits (reciprocal)” has deteriorated in February and March after eight months of improvement. This indicator also indicates the trend of unemployment in the future (Note: Unemployment rate is usually a laggard indicator, following the indicators of production, consumption and employment).
3.The “Service Industry Employment Net Entry Rate” cycle index is highly volatile. 2016/10 took the lead in recovery, but it turned down in 2017/5, 2017/10 went up again, 2018/2 went down again, and continued to drop in April. This indicator will affect future employment trends (Note: Employment is usually a coincident indicator.)
The volatility and weakening of investment and employment led to the declination of the Coincident Composite Index in October, and continue in November. The Leading Composite Index also started falling in April. The other three sub-indicators, "Transport and Warehousing Real GDP", "Service Net Trade Balance" and "Commercial Services Stock Price Index" was rising in April.
The changes of the sub-indicators of Coincident indicator shows the reason of the current recovery weakness
Because of the volatility and the insufficient scope of economic activities, a single indicator must be compiled with a comprehensive index of the business cycle a to predict and display the overall trend of the cycle. However, analyzing the individual performance of a single indicator can see the path and scope of the diffusion, and it’s an important basis for the countermeasures being taken for economy.
According to the Coincident Index that represent the overall GDP trend, among the five sub-indicators of the Coincident Composite Cycle Index, “The Number of Employees in the Service Industry” fell in March and April, and the “Real GDP of Real Estate and Residential Services” started to fall from 2015/9, other "Wholesale and Retail Actual GDP", "Financial and Insurance Actual GDP" and "Water, Electricity, Gas and Fuel" has been rising in April. Which means the overall business was still on the way to recovery in April, though weak due to the "Construction Cycle" on real estate and residential services and employment in the overall service industry.
“Construction Cycle” is a is a long-wave cycle that is longer than the "Fixed Investment Cycle". The author has observed that the real estate business cycle is ahead of the general business cycle, and the average period is 100 months, but the average expansion period is 30 months and the contraction period is 73 months according to the “Taiwan Real Estate Business Quarterly Report”. This is contrary with the other cycles that have shorter contraction than expansion period, some people regarded it as the "reverse cycle" of general prosperity. Reported in June 2014 is the high point of Taiwan's housing prices, compared to the past Construction Cycle, shows it is still in the contraction period now and may remain the same until 2020. The real estate and residential service output value of this indicator system during this recovery period of commercial service industry, shows that the stability and economic growth. More measures and policies should be taken by the government to prevent speculation in order to improve the economy growth.
Will the slow recovery of the new mediocre economy, which began in May 2017, end in the end of the year? The National Development Council’s business indicators also show similar trends.
The previous cycle analysis had been compared with the previous cycles and found that this is a "low equilibrium" phenomenon caused by the impaired overall economic structure after the financial crisis., which is also a result of the so-called new mediocre economy. The author then makes an analysis and comparison with the economic indicators compiled by the National Development Council.
1. Comparing the leading indicators of the National Development Council and CDRI (picture below), it is found that the NDC’s forecast of recovery is shorter and more consistent than the forecast of CDRI, on the contrary, NDC’s forecast on recession is longer and less consistent than the forecast of CDRI. The best leading indicator is that the advancing time should be long enough to provide timely reference for the government and private enterprises, but it should not be too long to cause incorrect judgments and interfere economic and market behavior. Consistency is more important, if the forecasting time of each cycle is different, it is more likely to be unpredictable. The Indicator System of NDC is for the overall economy and our system is designed for commerce service industry. Taiwan’s commerce service business cycle is laggard (following) the overall business cycle as the analysis shows.
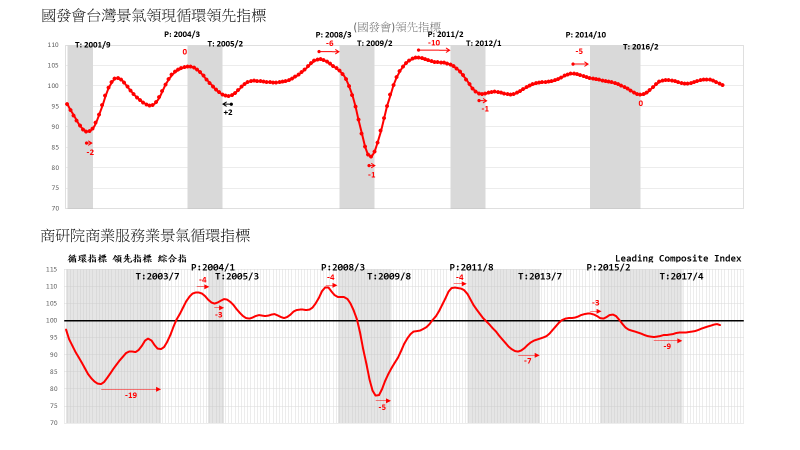
2. The leading indicator index of the NDC, the leading index cycle index hit the top in November last year, and has dropped continuously for half a year in May. According to its historical record, since the beginning of 1984, the leading actual recession has occurred for a maximum of 11 months, with 9,6,5,4,3,2,1, and so on, and there are very few laggard (which means the leading indicator fails). In short, in the longest month of November, the overall economic downturn in Taiwan is extremely likely to decline at the end of this year. Unless strong and effective incentives are applied immediately.
3. The expansion period of previous cycles, from 2001 to the most recent recession (2014/10), a total of four expansions, the longest is 37 months (2005/2-2008/3), the shortest is For 24 months (2009/2-2011/2), last time was 33 months (2012/1-2014/10), and the average length of the four expansion periods was 31 months. The recovery that began in 2016/2 has been 26 months so far, and it will be 34 months if it continues to recover to the end of the year. It also shows high risk of declination at the end of the year.
4. According to NDC’s leading indicator, although there are uncertain fluctuations, if the leading indicators continue to decline for eight months, it is expected that there will be a real recession. At present, the leading indicators have dropped for half a year in May. June and July are observation periods. If it continues to decline for two months, it is very likely that there will be a recession. The longest recession is 11 months in the past, which means that it is difficult to avoid the possible recession at the end of the year from now without the implement of effective economic incentives as soon as possible.
Business Cycle Coincident Composite Index for Taiwan Service Sector
|
year/month
|
Cycle Indicator
(Trend Value=100)
|
Remark
|
|
2018-11
|
100.0842
|
(p)
|
Predicted from the Leading Index of 2018/4~5
|
|
2018-10
|
100.1796
|
(p)
|
|
|
2018-9
|
100.2289
|
(p)
|
Based on the Coincident Composite Index of the Leading Composite Index
|
|
2018-8
|
100.2032
|
(p)
|
|
2018-7
|
100.1657
|
(p)
|
|
2018-6
|
100.1244
|
(p)
|
|
2018-5
|
100.0817
|
(p)
|
|
2018-4
|
99.8280
|
(f)
|
Actual value of Coincident Composite Index
|
|
2018-3
|
99.7229
|
(a)
|
|
2018-2
|
99.6647
|
(a)
|
|
Source: Business Cycle Forecasting Team of CDRI
|
| |
|
a
|
actual
|
|
|
|
f
|
forecasted
|
|
|
|
p
|
predicted
|
Business Cycle Composite Index for Taiwan Service Sector
Source: Business Cycle Forecasting Team of CDRI
|
Previous Cycle:
|
Cycle
|
Trough
|
Peak
|
Trough
|
|
1
|
2003/7
|
2004/10
|
2005/3
|
|
2
|
2005/3
|
2008/3
|
2009/8
|
|
3
|
2009/8
|
2011/8
|
2013/7
|
|
4
|
2013/7
|
2015/2
|
2017/4
|
|