Commerce Development Research Institute released the "Taiwan's commercial service industry cycle comprehensive index" which predicts that the business service industry in Taiwan will drop slightly in Q4 after three consecutive months of decline and start to rise from January next year. The risk of domestic demand decline in the service industry market will be slightly reduced by the end of the year. However, the current recovery momentum is still weak.
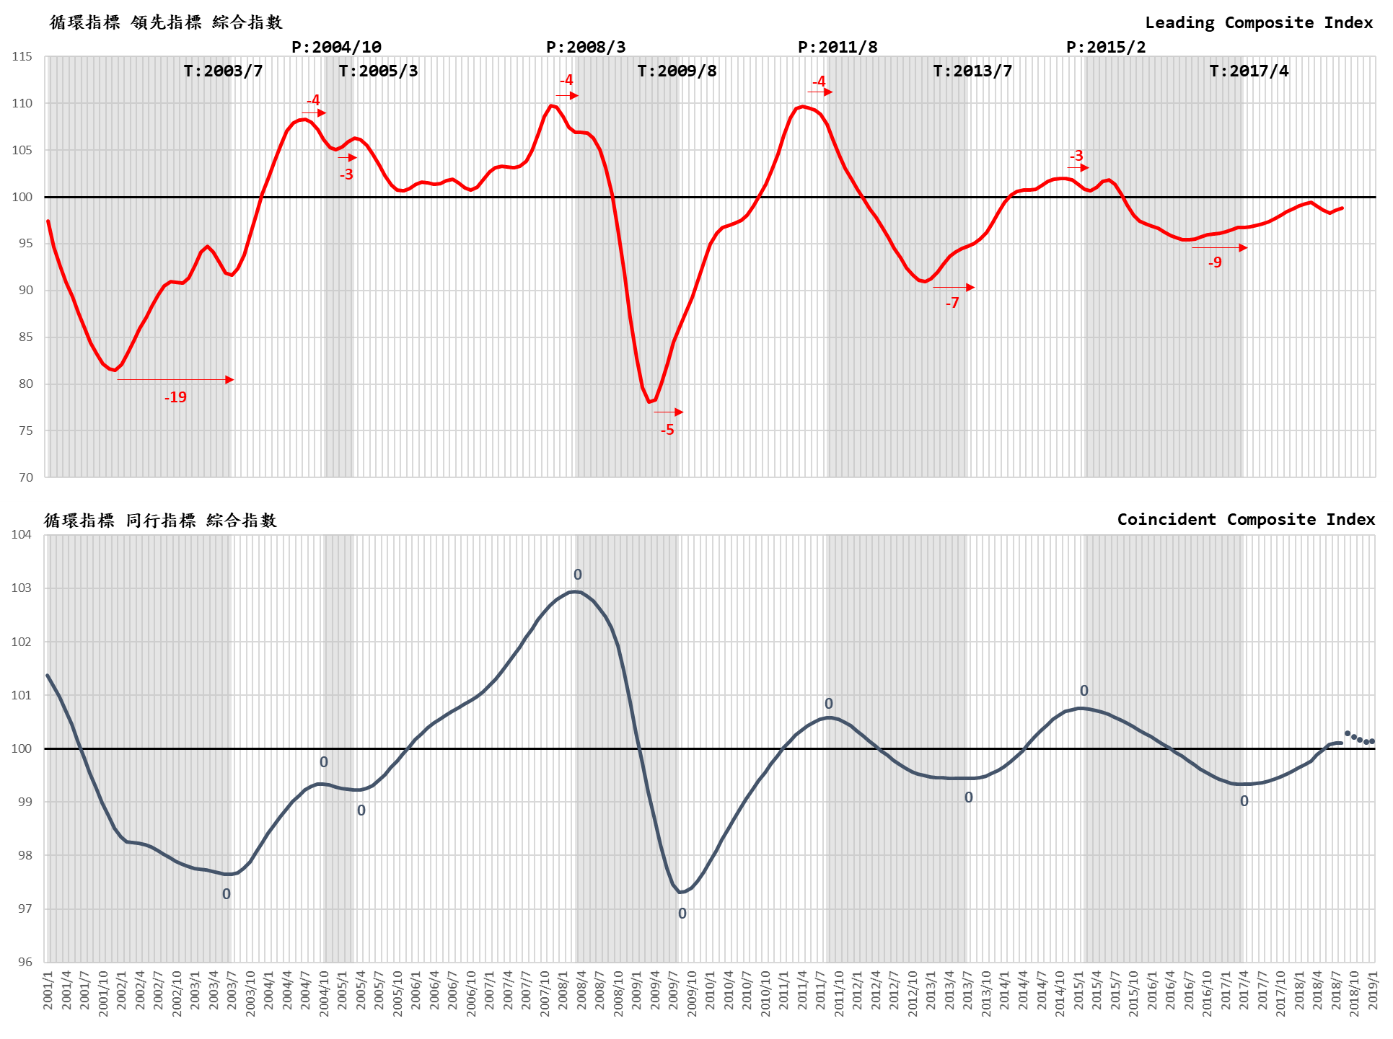
A. The leading indicator of the service industry shows the actual value declined noticeably in Q2 as predicted. Slightly rose in July and August.
The actual value of Cyclical Leading Composite Index for service industries kept decline in Q2 for three months, started to rise in July and August.
The predicted value of seasonal data: In July and August, except for the decline in the net service trade, the actual GDP including transportation and warehousing, and the private real fixed capital formation which started to rise in April and the net entry rate of employees in the service industry all continued to rise. As the prediction in the past, the actual value of the six sub-indicators in Cyclical Leading Composite Index are continuously declining in April, May and June. The coincident composite index that can predict the future prosperity is likely to continue declining in October, November and December this year. However, according to the seasonal data in July and August, only the net service trade continued to decline, the actual GDP of transportation and warehousing, the private real fixed capital formation, the net entry rate of employees in the commercial service industry, the actual value and the predicted value of August of the number of initial recognition of unemployment benefits (inversion), and the commercial services stock market index in July and August all increased.
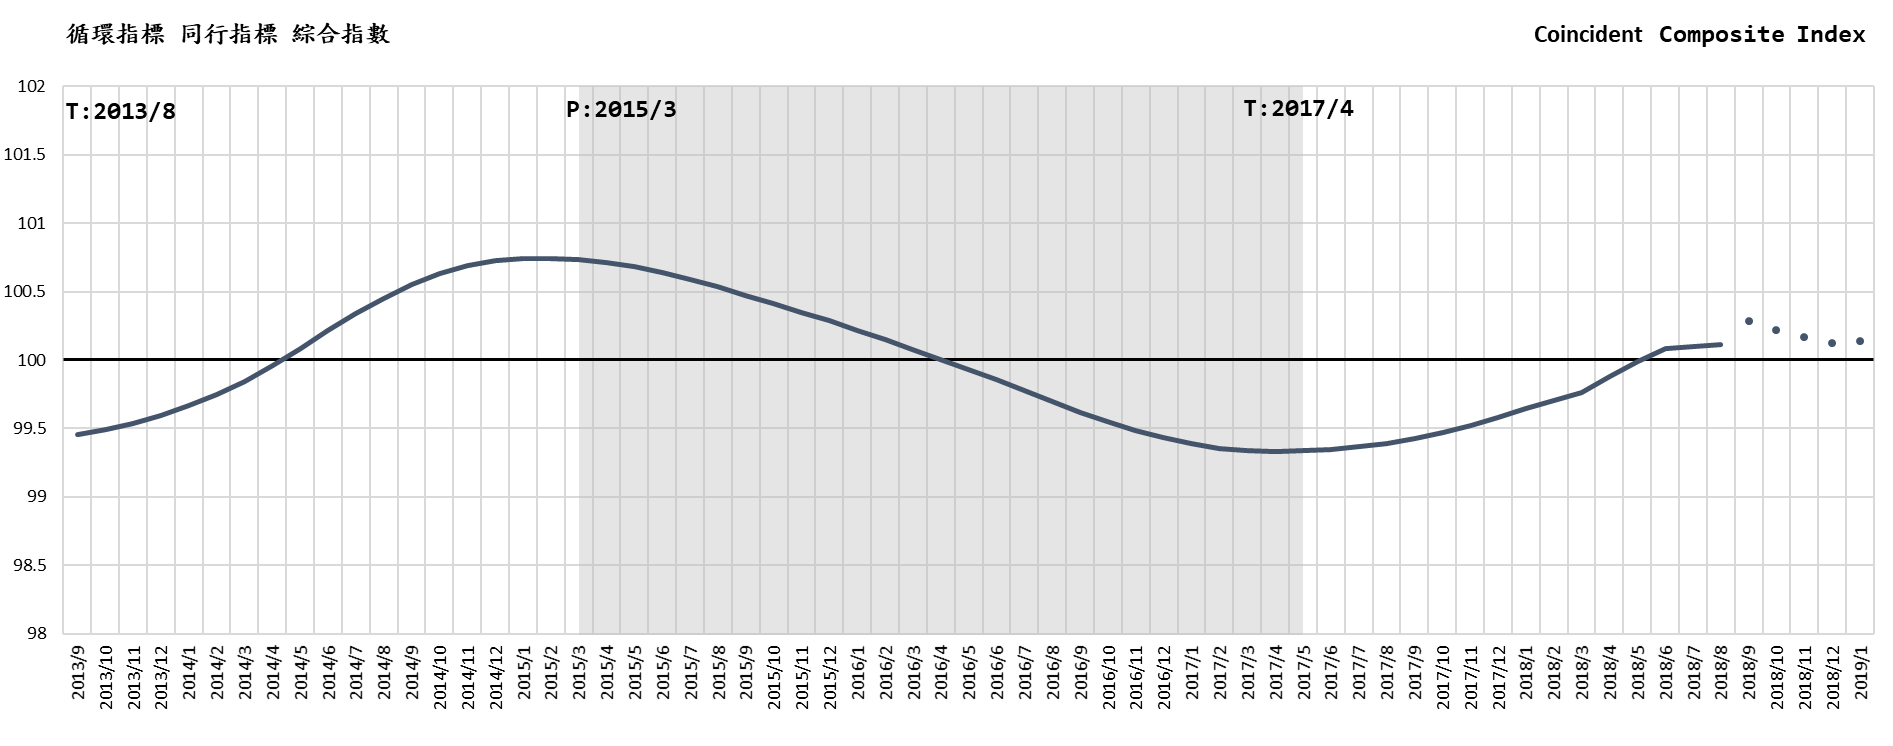
Recent trends and forecasts of the coincident cycle index
B. The six sub-indicators of the leading indicators showed the employment stopped falling in June, and the investment in Q2 rose. The stock market went down in May and June and then rebounded in July and August. Incentive measures are recommended to enhance the rally.
The Q1 data published by the Directorate-General of Budget, Accounting and Statistics of the Executive Yuan, three of the six sub-indicators of leading indicators were found declining. The “ Private Real Fixed Capital Formation ” cycle index which continuously declined from January to March; the cycle index of “initial recognition of unemployment benefits (reciprocal) “ declined in February and March; the “commercial service industry entry rate” cycle index decreased in February and March. The lack of investment and employment led to declining of the leading composite index in October
In Q2, two sub-indicators which represent the employment kept decline in April, May and June and then turned up in July and August. The index which represents investment rarely continued to rise in April, May and June, predicted value kept the rose in July and August. The service stock price index turned downward in May and June; the actual value has resumed its upward trend in July and August. The coincident cycle composite index which predicted by the leading composite index continues to decline in December, It is expected to turn up in January next year, but the rebound will be slight.
The two leading sub-indicators that can directly reflect the employment trends of the future commerce services industry continued to decline in the first half of this year, which of course adversely affected the employment and thus domestic consumption. However, the actual value in July and the predicted value in August of the number of initial recognition of unemployment benefits (inversion) were rising, which is another good sign. The number of employed persons published by the Directorate-General of Budget, Accounting and Statistics of the Executive Yuan increased by 84,000 compared with the same period of the previous year. The service industry increased by 61,000, and the wholesale and retail industries increased by 25,000 and the manufacturer industry increased by 25,000. The employment of Taiwan's service industry is as high as 1.64 times that of the industry. The service industry's prosperity affects employment and consumption. The employment income and consumption effect should compensate for the consumption contraction of annuity reform to a certain extent, but the service industry has a tendency of low salary, incentive measures will be needed.
C. The sub-indicators of the coincident indicators show different trends in various sectors, affecting the recovery of the comprehensive index
Taiwan's service industry continued its recession since March 2015 and rebounded in May 2017. The actual value shows that the coincident composite index (excluding long-term trend) exceeded 100 for the first time in June which was 100.0801. It took14 months to exceed the long-term trend, with an average monthly increase of 0.05345, much slower than the average monthly increase of 0.06421 in 2013/8~2014/5 (100.0859), and the average monthly increase of 0.1584 in 2009/8~2011/1 (100.0084).
D. Transformation of the structure is more urgent than improve the economy
Taiwan economy is more volatile and vulnerable. For example, after the economic depression in 2008, the United States began its recovery in July 2009 and had not yet declined for nine years. In the second quarter, it has also experienced a record high of growth in the past four-year which is 4.1%; this is the second most extended recovery in history. The recovery was only shorter than the one between April 1991, and March 2001. However, according to the economic cycle index released by the National Development Council, the overall economy of Taiwan has experienced two recessions which were in 2011/3-2012/1 and 2014/11-2016/2 after the recovery in March 2009. CDRI’s study also determined that Taiwan's commerce service industry has experienced two recessions which were from 2011/09-2013/7 and 2015/3-2017/4.
Research on whether the international economic cycle is synchronized shows that only the major world economic crisis such as the oil crisis of the 1970s and the depression in 2008 can synchronize the national economic cycle. Otherwise, each nation has their economic cycle depends on their economic structure, foreign trade, international finance convergence, fiscal structure, economic policy, and so forth. In other words, all countries have their own space and opportunities and should be responsible for their economic stability and growth.
However, “achieving” profits is essential to effective demand, rather than “creating” profits. The creation of profits comes from the foundation and reformation of supply, investment willingness and action, business strategy and management, technological revolution, value innovation, systematic reform, and structure upgrade, etc.
Although the so-called VUCA era is a period of uncertainty and volatility in the short term, it is a new era for exploiting new economy and new market. Replacing technology and manufacturing drive with value and service, take the digital transformation of the economy and enterprises as a force of economic redevelopment, and internationalized services as the guarantee for the sustainable development of enterprises. It is when the investment in the digital network starts to boom that we may ensure that we will soon break out from the low-balanced, flattening long-term trend of economic growth.
(Business Cycle Indicator System is designed, instructed and analysed by professor Tain-Tsair Hsu)
Business Cycle Coincident Composite Index for Taiwan Service Sector
|
Year/Month
|
Cycle Index
(trend value=100)
|
Remark
|
|
2019-01
|
100.1362
|
(p)
|
Predicted by leading indicator in 2018/7
|
|
2018-12
|
100.1261
|
(f)
|
Coincident index composite index predicted by the leading index composite index
|
|
2018-11
|
100.1669
|
(f)
|
|
2018-10
|
100.2212
|
(f)
|
|
2018-09
|
100.2814
|
(f)
|
|
2018-08
|
100.1096
|
(f)
|
|
2018-07
|
100.0977
|
(f)
|
|
2018-06
|
100.0801
|
(a)
|
Coincident composite index actual value
|
|
2018-05
|
99.9875
|
(a)
|
|
2018-04
|
99.8823
|
(a)
|
|
Source:Business Cycle Forecasting Team, CDRI
|
| |
|
a
|
(actual)
|
|
|
|
f
|
(forecasted)
|
|
|
|
p
|
(predicted)
|
Business Cycle Composite Index for Taiwan Service Sector
Source:Business Cycle Forecasting Team, CDRI
|
Previous Cycle:
|
Cycle
|
Trough
|
Peak
|
Trough
|
|
1
|
2003/7
|
2004/10
|
2005/3
|
|
2
|
2005/3
|
2008/3
|
2009/8
|
|
3
|
2009/8
|
2011/8
|
2013/7
|
|
4
|
2013/7
|
2015/2
|
2017/4
|
|