CDRI ‘s "Business Cycle Comprehensive Index for Taiwan Service Sector
" predicts that Taiwan's business of service industry will slow down in Q4 but will rebound to the long-term trend in Q1 next year.
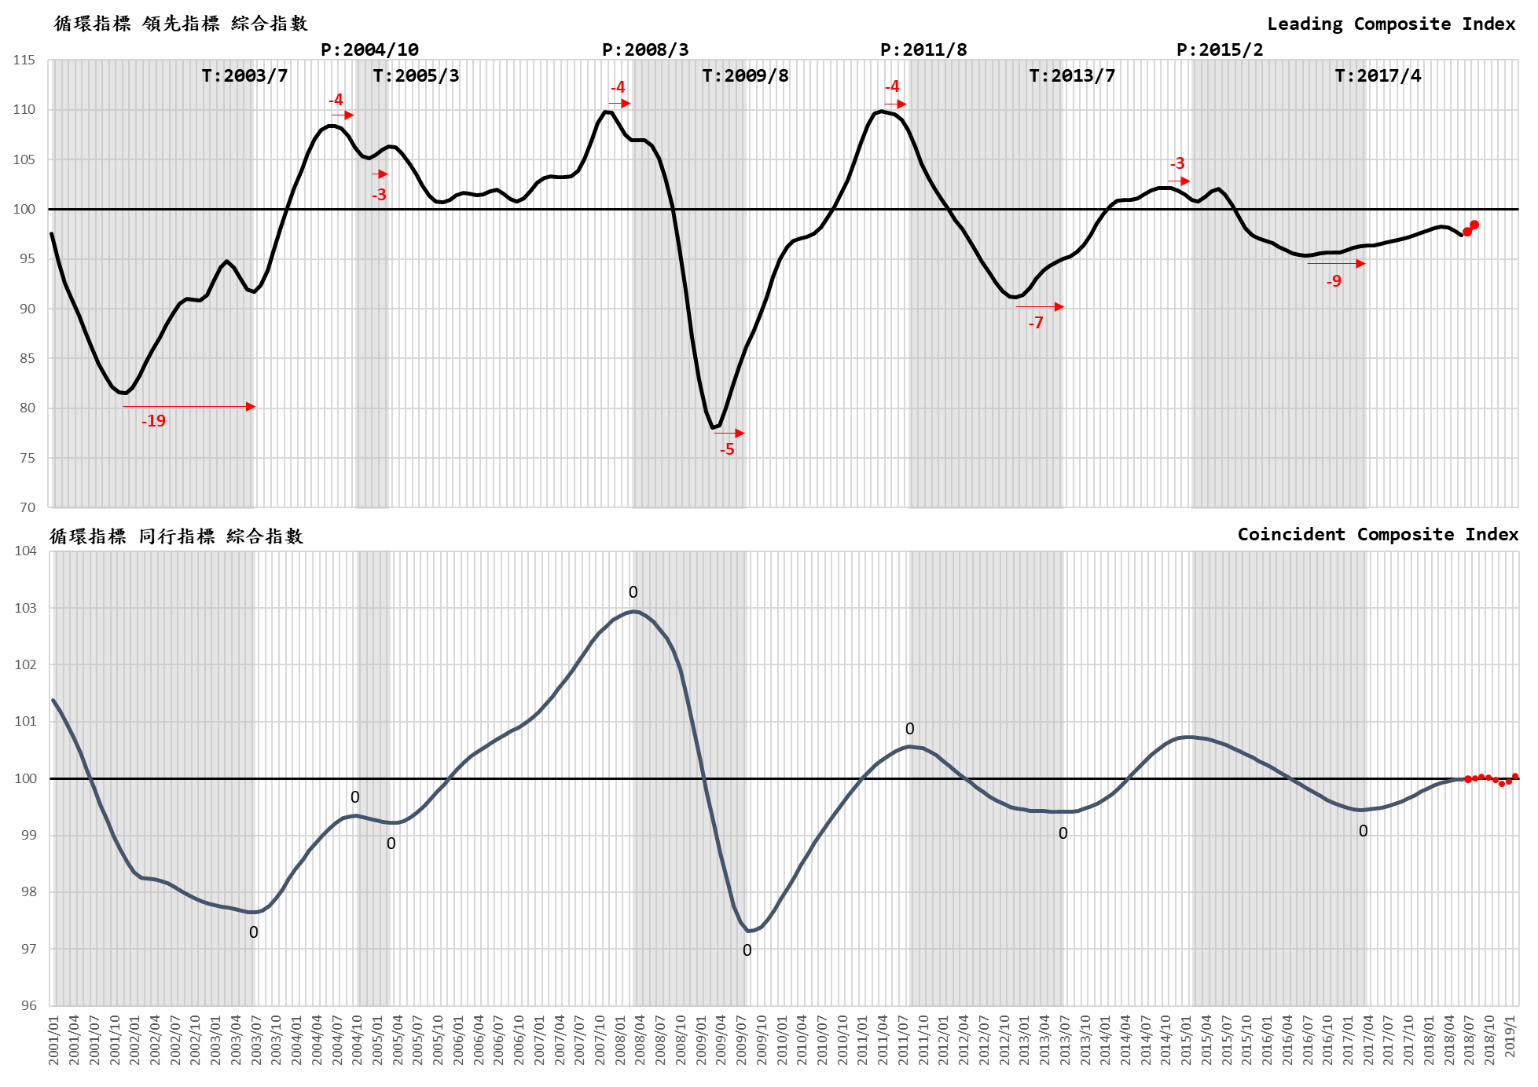
A. Cyclical Leading Composite Index for service industries
After the actual value fell for three consecutive months in Q2, the forecast value rose in July and again in August, that makes the Cyclical Coincident Composite Index which is predicted to represent the trend of GDP, to rise and fall in Q4 this year, and will continue to rise in January and February next year; which means even though Taiwan's service industry had recovered in May last year after recovering from the long-term trend level in August, it has not been able to accelerate the rising. Related stimulus should be strengthened to ensure that the economy will continue to recover next year. (See attached table and chart 1)
B. Leading indicator trend analysis(see chart 2)
The leading indicator cycle composite index has been unstable since Q2 this year, and it has risen again in July and August due to the divergence of the six sub-indicators. In fact, the Leading Indicators Cycle Composite Index has not recovered its long-term trend level (100) since it began to rebound in August 2016.
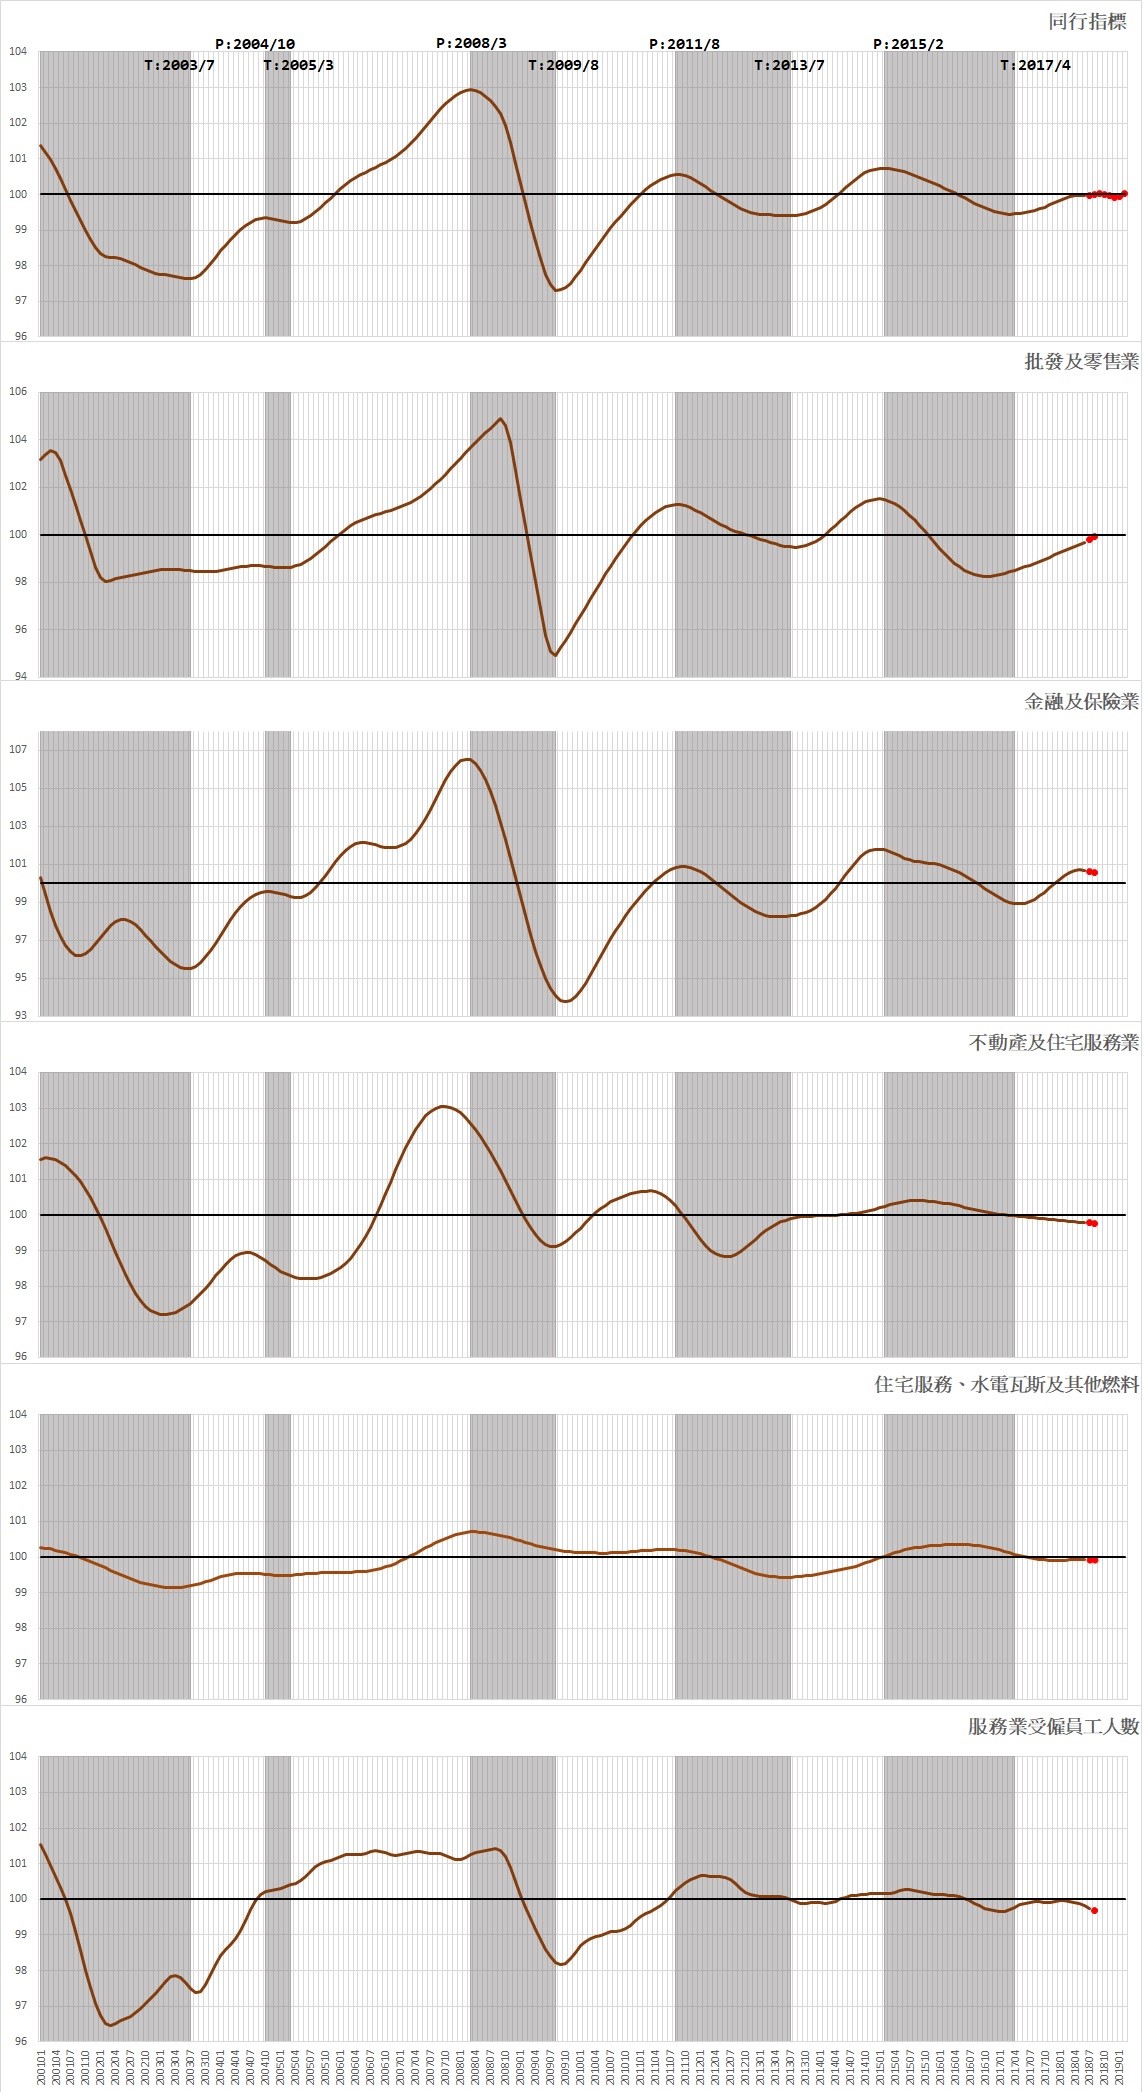
C. Coincident indicator trend analysis (see chart 3)
The coincident comprehensive index cycle trend value has recovered since the end of April 2017 (index 99.45), including the actual cycle value and the cycle value predicted by the leading indicator composite index. Although it has started to fall in Q4, will rise again in January and February.
(Business Cycle Indicator System is designed, instructed and analysed by professor Tain-Tsair Hsu)
Business Cycle Coincident Composite Index for Taiwan Service Sector
|
Year/Month
|
Cycle Index
(trend value=100)
|
Remark
|
|
2019-02
|
100.0401
|
(p)
|
Predicted by leading indicator in July and August 2018
|
|
2019-01
|
99.9453
|
(p)
|
|
2018-12
|
99.9047
|
(f)
|
Coincident index composite index predicted by the leading index composite index
|
|
2018-11
|
99.9691
|
(f)
|
|
2018-10
|
100.0094
|
(f)
|
|
2018-09
|
100.0181
|
(f)
|
|
2018-08
|
100.0004
|
(f)
|
|
2018-07
|
99.9753
|
(f)
|
|
2018-06
|
99.9773
|
(a)
|
Coincident composite index actual value
|
|
2018-05
|
99.9753
|
(a)
|
Source:Business Cycle Forecasting Team, CDRI
a. (actual)
f. (forecast)
p. (predicted)
Chart 1
Business Cycle Composite Index for Taiwan Service Sector
Source:Business Cycle Forecasting Team, CDRI
Chart 2 Leading composite index and its sub - cycle index (2001~2018)
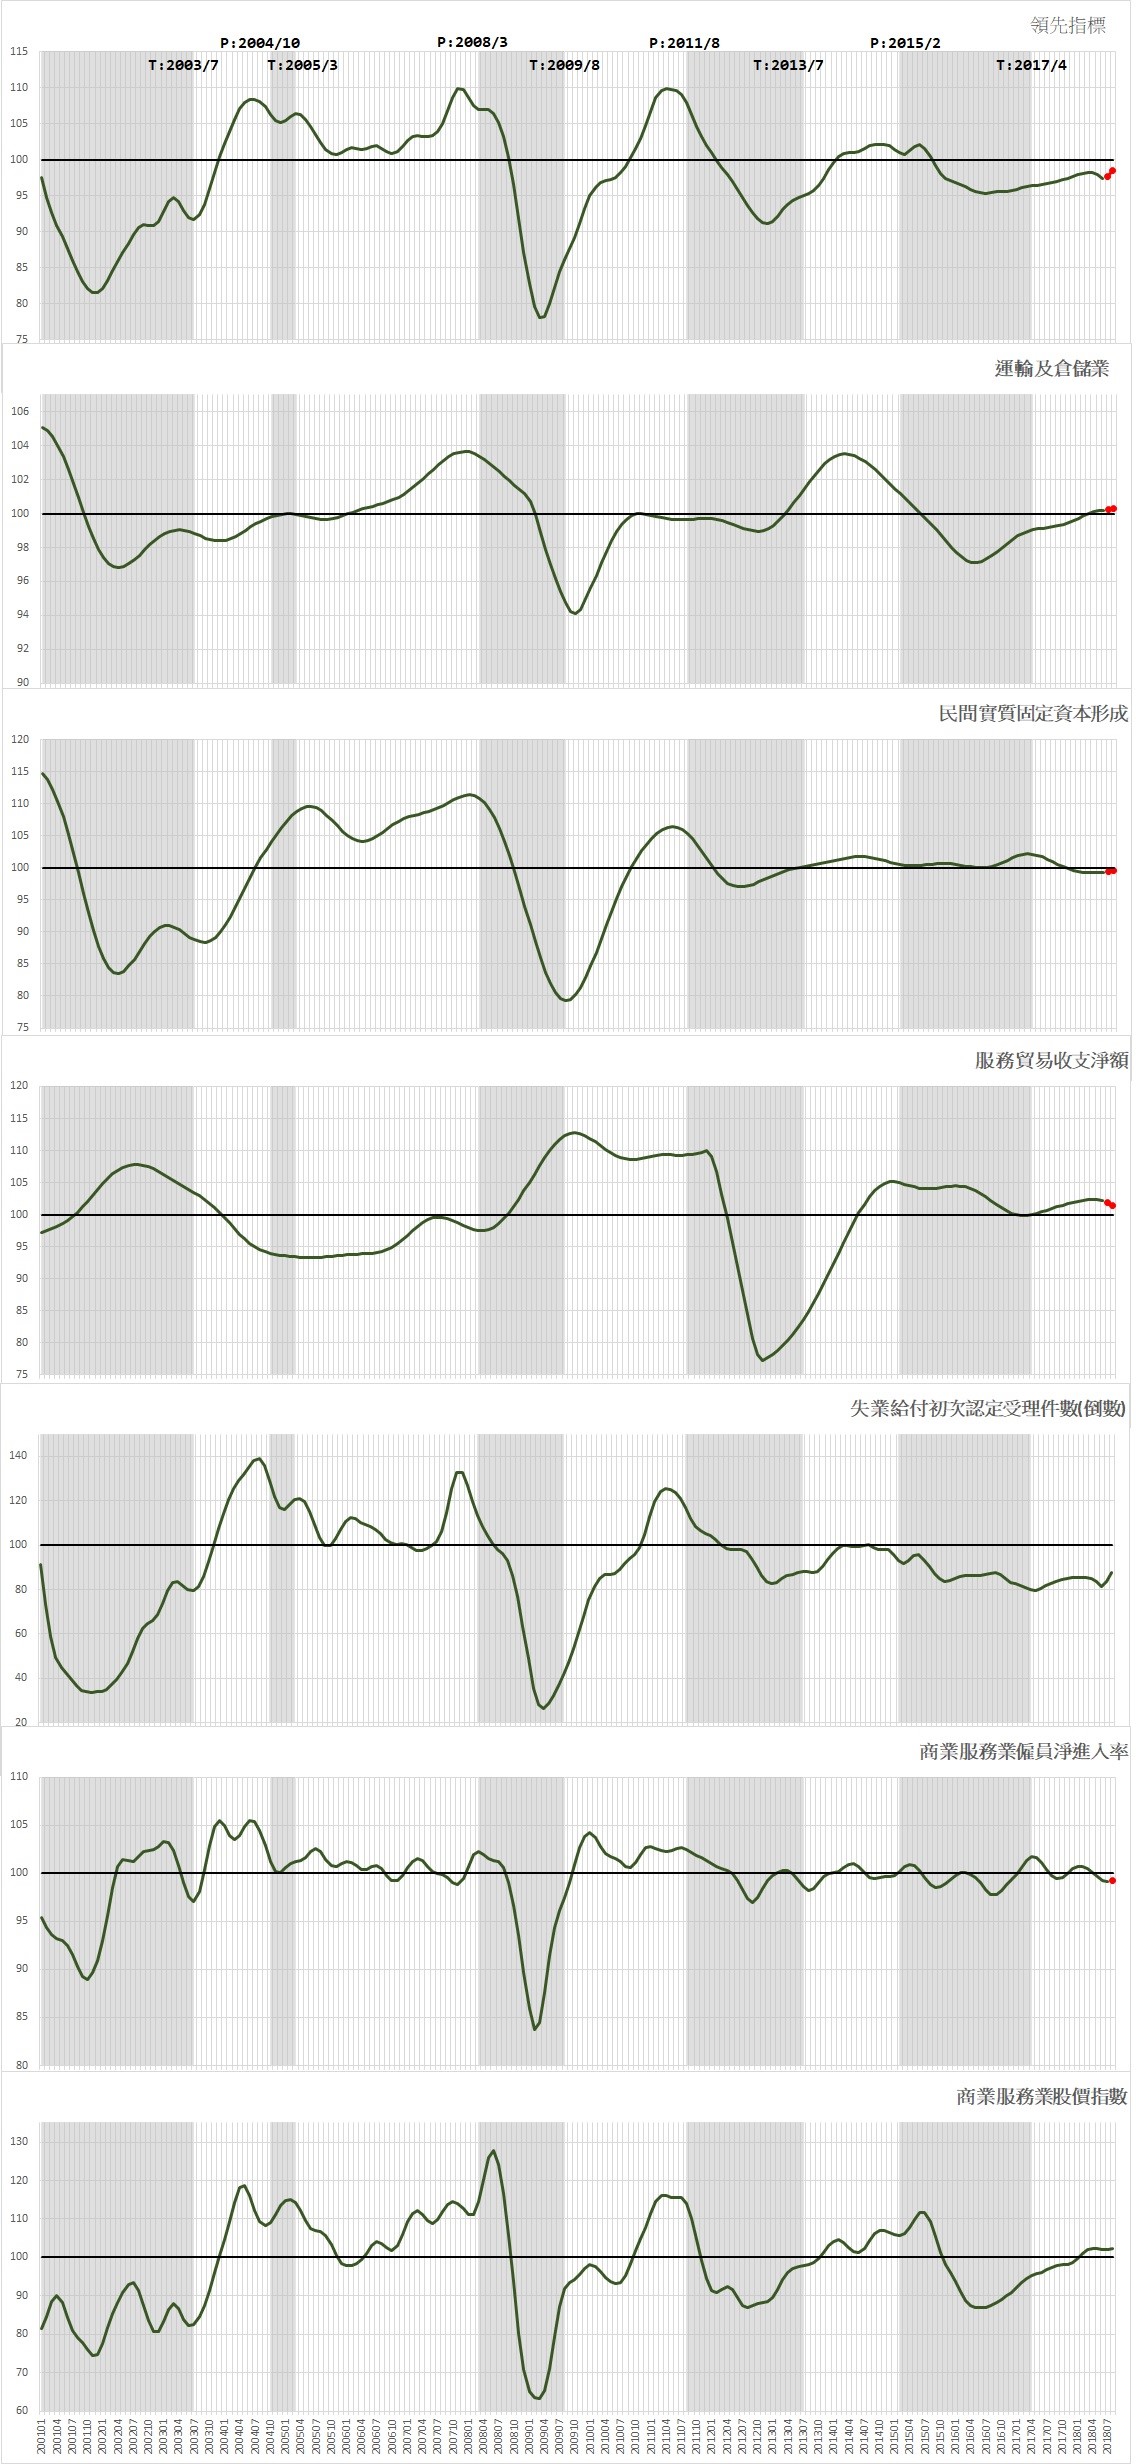
Chart 3 Coincident composite index and its sub - cycle index (2001~2018)