Commerce Development Research Institute released the Business Cycle Coincident Composite Index for Taiwan Service Sector which has hit the top in May last year is expected to rebound slightly in May and June this year after the declination for 11 months. This also means that the Taiwan service industry is heading upwards in the impact of the international economy and the downward pressure. The most significant turning point will be the possibility of the employment sector to rise from the trough. However, the overall rebound is still weak.
The system uses the leading indicator cycle index to predict the future trend of the coincident index.
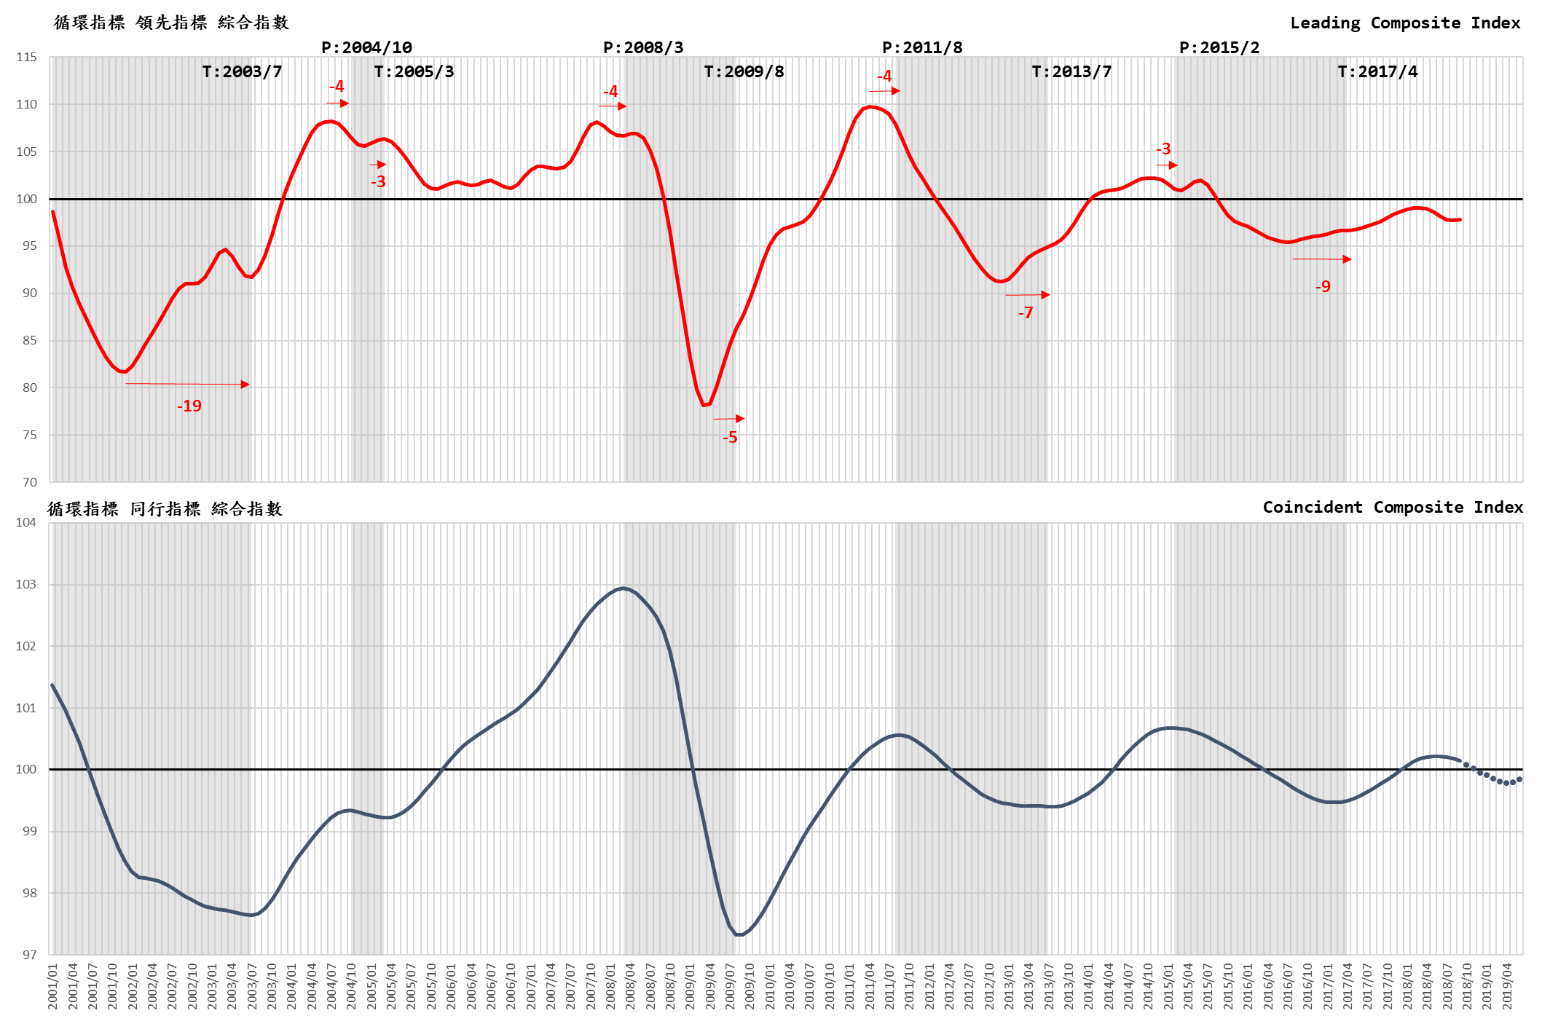
The leading cycle composite index peaked in March last year and rebounded in September after a five-month decline. It has risen steadily for five months in January. According to the three cycles after the financial crisis, after 5 to 9 months after the rebound of the leading index, the coincident index will show actual "recovery". It can be expected that recovery in May might happen after the current decline in the business service industry this year.
It is observed that the leading composite index and the predicted coincident composite index are still lower than the long-term trend value. The trend of each sub-indicator is still fluctuating, indicating the existing of uncertain risks.
A. The actual value of the leading indicators of the service industry showed a declining trend after hitting the top in March this year. The sub-indicators of the employment sector, initial recognition of unemployment benefits in December was much improved for two consecutive months, changing the composite index and rising the leading composite index slightly since September.
The actual value of Cyclical Leading Composite Index for service industries(cycle value of long-term trend excluded)peaked in March 2018 and then fell. The cycle index has fallen from 99.044 in March to 97.714 in August and rebounded in September. It was 98.7348 in January 2019 (including partial estimates), indicating that the coincident indicator representing GDP is not seemingly growing.
At the same time, the actual cycle value of the coincident composite index which predicted by Cyclical Leading Composite Index for service industries peaked in May 2018 and then fell to 99.9105 in January 2019. It is predicted to return to 99.802 in May this year and 99.8486 in June. The level of October 2017 (pictured below) which is lower than the level of 2018 that barely exceeds the long-term trend, indicating an immediate recovery with weak strength.
The trend and strength of the leading index and the coincident composite index show that although the commercial service industry has regained its long-term trend level (100) last year since its recovery in April 2017, it is still not as good as in 2014-2015. The fluctuations are unstable, and the trends between the sub-indicators are mutually up-and-coming. Economic stimulus measures against the stagnation should be taken. The Private Real Fixed Capital Formation, the initial recognition of unemployment benefits (reciprocal) and the net rate of employees in the commercial service industry continued to rise, indicating that the improvement of the domestic demand has become the main force against the doldrums. In the time of digital transformation, the US-China trade war effect and the impact of the end of 40-year glory of the Chinese market, Taiwan has leveraged its efforts to promote domestic investment and industrial transformation and upgrading and deepen the new Southbound investment and trade. As a result, expanding the export market to improve the value chain structure is the way to overtake in the new international economic game.
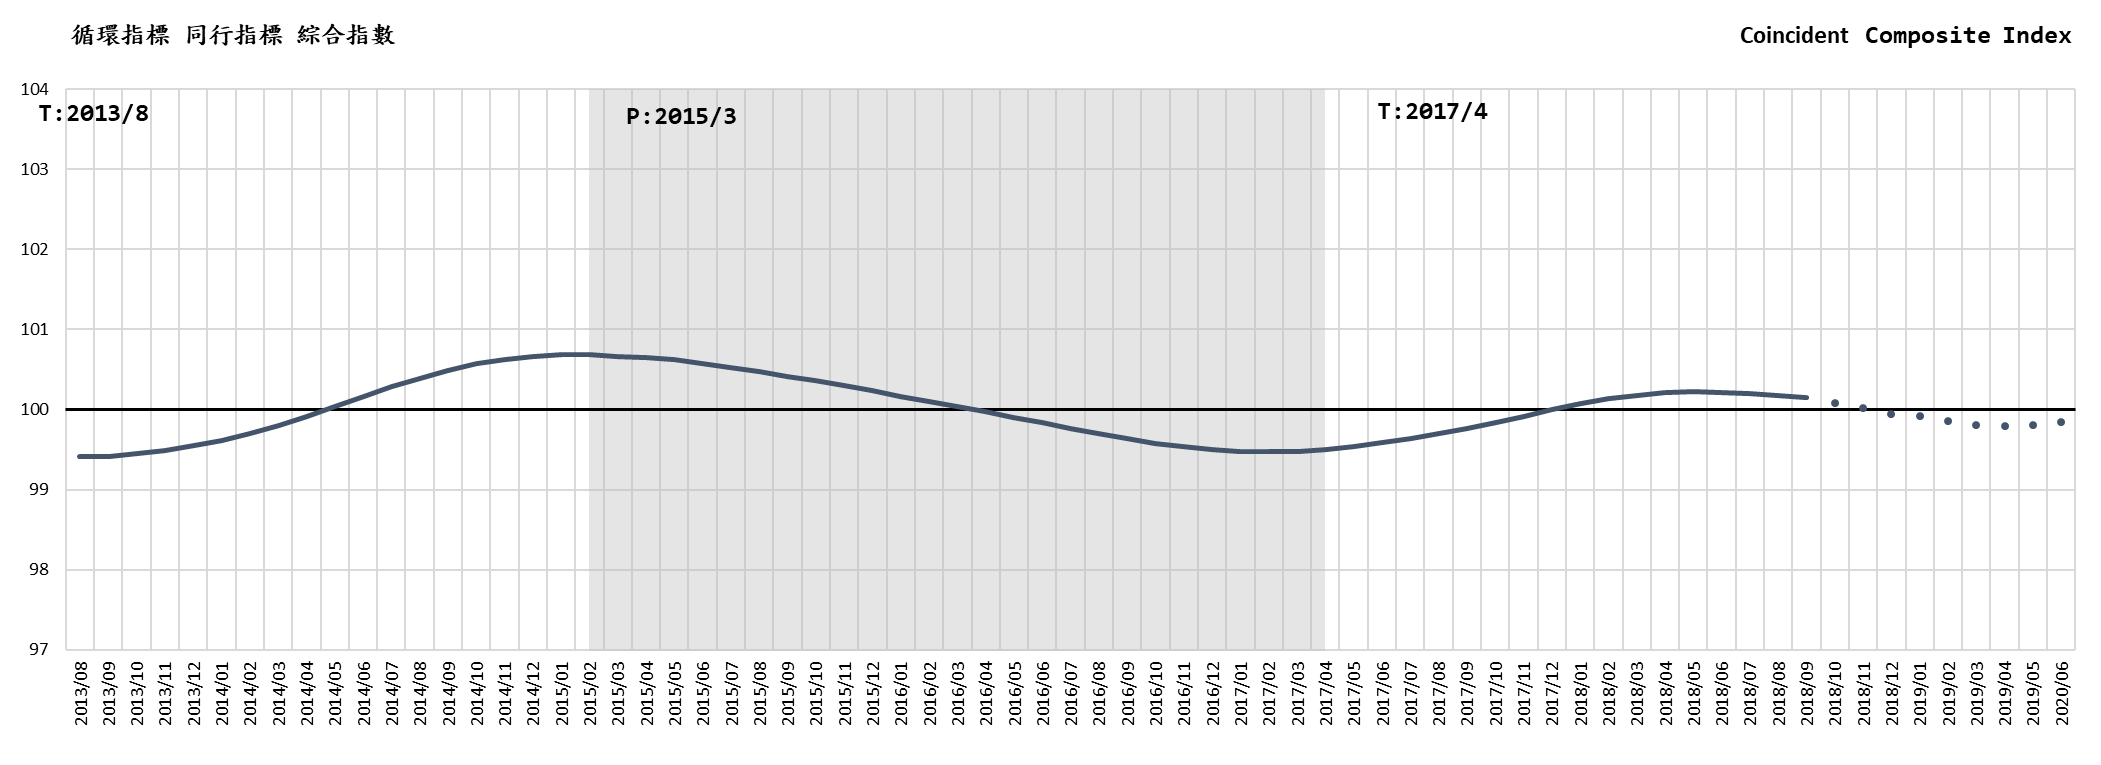
The recent trend of Coincident indicator cycle index
B. The six sub-indicators of the leading indicators for the poorer-performing employment had a new turn, and the Private Real Fixed Capital Formation which has always been volatile has continued to rise for eight months, which is the main force for the rebound of the latest leading indicators. Since the October stock market crash, the commercial services stock price index has continued to decline; and the service industry's trade balance has fallen back to a lower level in the first half of the recovery in March of this year; transport and warehousing industry also begun to fall in the second half of 2018, it has returned to the level of the long-term trend in October of the previous year in January 2019. The apparent difference in the trend of the departments provides a useful reference for the government. The downturn indicates that resource, equipment, workforce and technology that are available for use are being idled and wasted. The short-term stimulus will not conflict with the long-term improvement of structure and productivity, which should both be applied.
C. Trends vary in the sub-indicators of coincident index, the composite index has continued to decline in June 2018, and the rate of decline accelerated in Q4, it is forecasted to fall back to the level of September 2017 in April this year, a slight rebound is foreseeable in May and June.
The Taiwan service industry started to slow down in March 2015 and recovered in May 2017. The actual value to May 2018 shows that the coincident cycle composite index (excluding long-term trend) has been rising. However, the actual value began to decline in June, and it has fallen to 100.1475 in September and will fall to 99.91529 in January 2019 (including partial evaluation), and the coincident composite index predicted by the leading composite index will continue to decline. It is predicted to drop to 99.715 in April this year, but will slightly rebind to 99.802 and 99.8486 in May and June.
The sub-indicators in the coincident indicators of the indicator system (which can show the real GDP changes in the service industry) have different trends in different sectors.
(Business Cycle Indicator System is designed, instructed and analysed by professor Tain-Tsair Hsu)
Business Cycle Coincident Composite Index for Taiwan Service Sector
|
|
Year/Month
|
Cycle Index
(Trend Value=100)
|
Remark
|
|
2019-06
|
99.8486
|
(p)
|
(P): Predicted by leading indicator from October 2018 to January 2019
|
|
2019-05
|
99.8020
|
(p)
|
|
2019-04
|
99.7915
|
(p)
|
|
2019-03
|
99.8056
|
(p)
|
|
2019-02
|
99.8533
|
(f)
|
Forecast based on the actual value of the Composite Index of Leading Indicators
|
|
2019-01
|
99.9105
|
(f)
|
|
2018-12
|
99.9499
|
(f)
|
|
2018-11
|
100.0182
|
(f)
|
|
2018-10
|
100.0837
|
(f)
|
|
2018-09
|
100.1476
|
(a)
|
The actual value of the Cycle Coincident Composite Index
|
|
Source: Business Cycle Forecasting Team, CDRI
|
| |
|
a
|
actual
|
|
|
|
f
|
forecasted
|
|
|
|
p
|
predicted
|
|
Business Cycle Composite Index for Taiwan Service Sector
Source: Business Cycle Forecasting Team, CDRI
Previous cycle:
|
Cycle
|
Trough
|
Peak
|
Trough
|
|
1
|
2003/7
|
2004/10
|
2005/3
|
|
2
|
2005/3
|
2008/3
|
2009/8
|
|
3
|
2009/8
|
2011/8
|
2013/7
|
|
4
|
2013/7
|
2015/2
|
2017/4
|