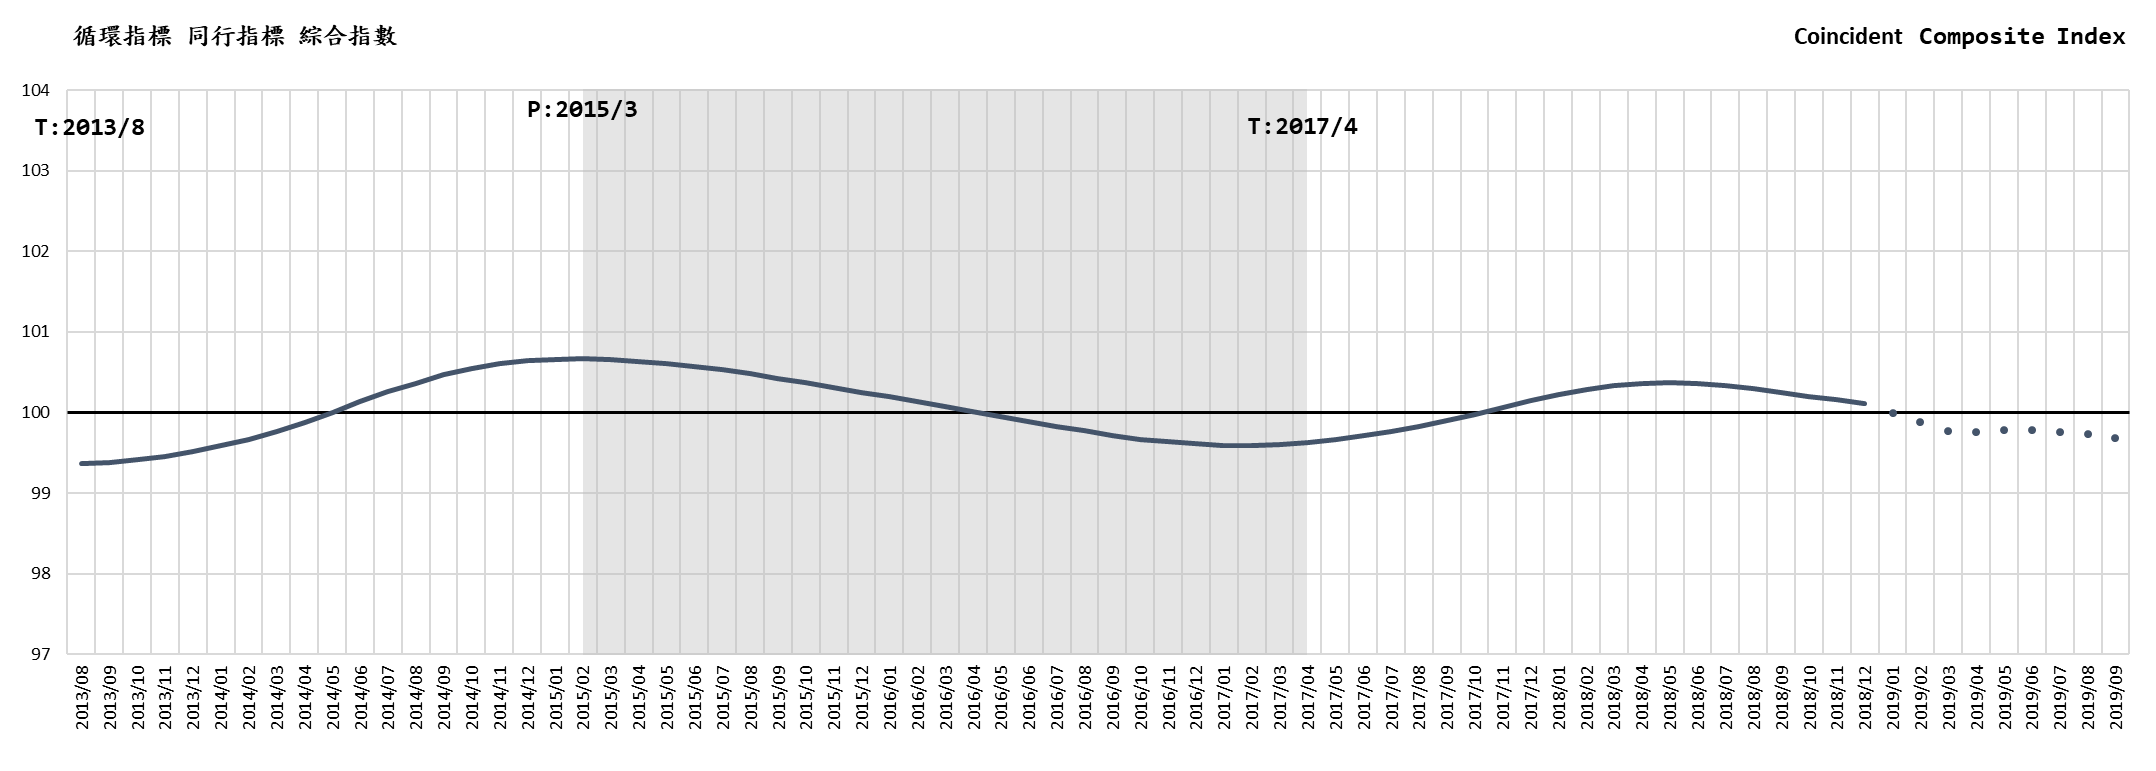
Commerce Development Research Institute released the Business Cycle Coincident Composite Index for Taiwan Service Sector today (6th May). It is predicted that it will continue to fluctuate slightly under the long-term trend (100) until September, this is the 16th month of declination since the last peak of the actual value in May last year. Although it is predicted to rebound slightly in May and June this year, it will decline slightly in Q3 again. Comparing the previous cycle index starts to fall below the long-term trend of 100, the current slope is the most gradual, which means that there is no risk of a sudden decline, though the upward momentum is insufficient. The measures being implemented by the government are effective but need to be accelerated.
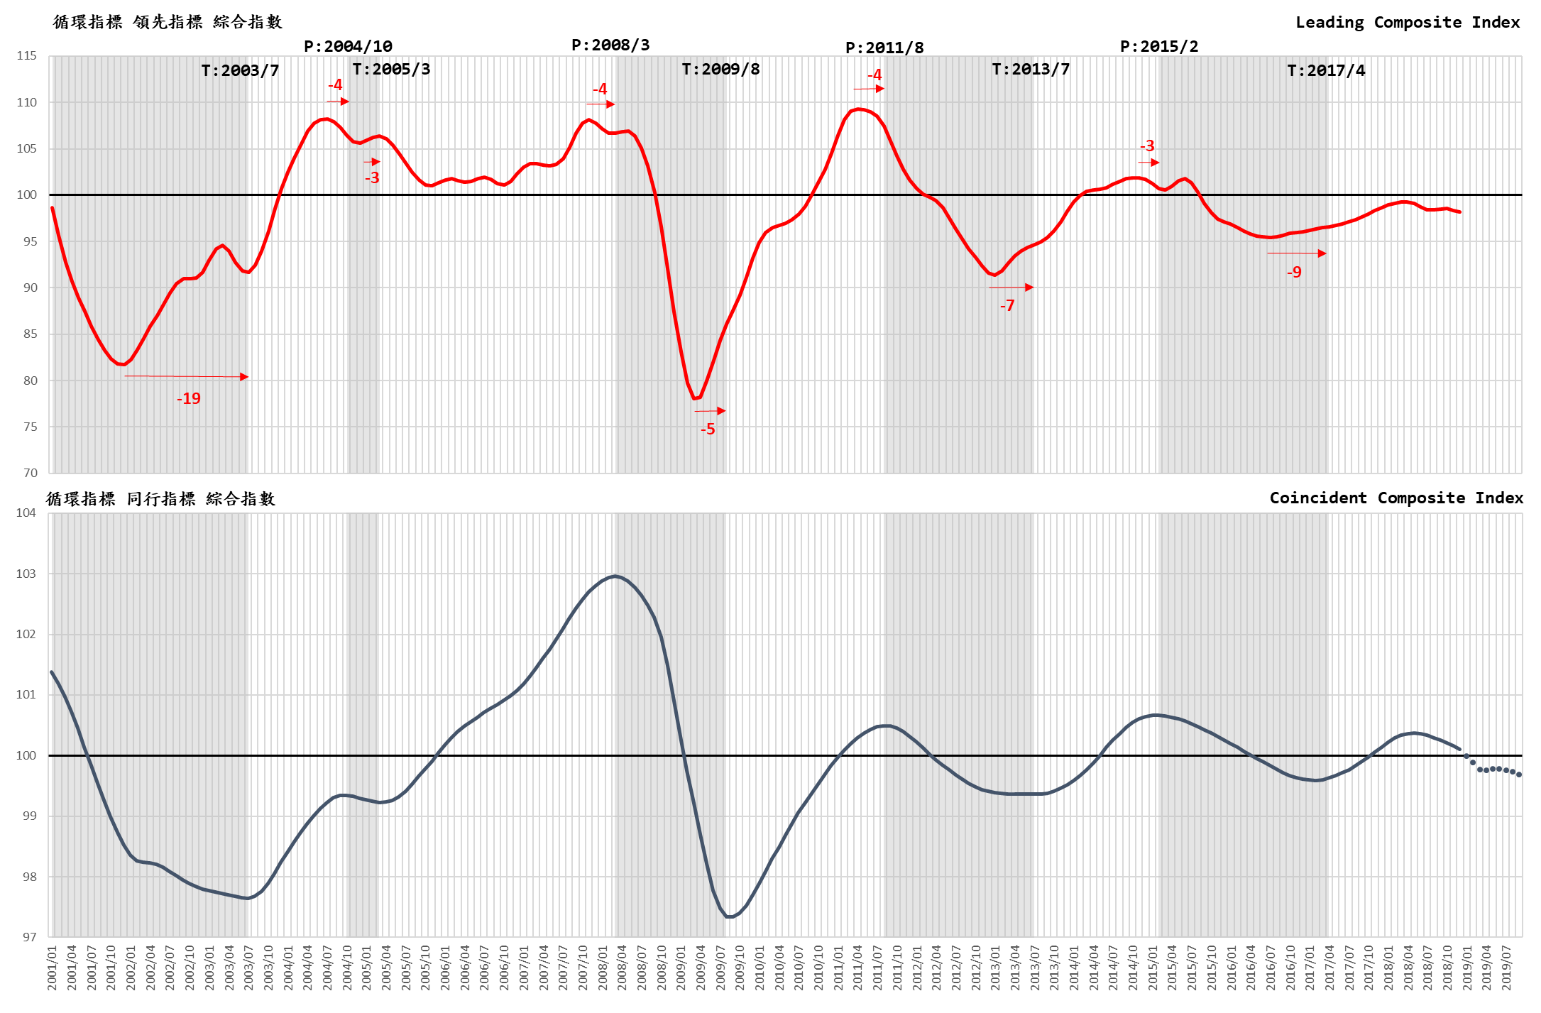
The actual value of the system's leading indicator cycle comprehensive index started to fell in April last year. Although it rebounded in September and October, has continued to rise from November to March. Since the bottoming out in July 2016, it has not recovered its long-term trend (100), it shows that the strength of the recovery is insufficient. At present, we must continue to implement the measures actively.
The recent trend of Coincident indicator cycle index
A. The actual value of Cyclical Leading Composite Index for Service Industries(Lon-term trend excluded)peaked in April 2018 and then fell, its cycle index has fallen from 99.24 in April to 98.38 in August and slightly rebounded to 98.54 in September and October, but then continued to fall to 97.17 in March and slightly rose to 97.18 in April. It shows that the leading indicators are low, and if there is no strong boost, it is difficult to see a significant rebound.
B. Sub-indicators of the coincident indicators varies in different sectors, the composite index has continued to decline in June 2018, and the rate of decline has gradually accelerated in the fourth quarter, especially Q1 this year. It is predicted that the cycle index will be lower than the long-term trend (100) from January this year and continue to decline. After a slight shock in May and June, it is predicted that it will fall to 99.69 in September. It is difficult to see a rebound, but the decline is easing off, and no risk of further decline at the moment.
|
|
Year/Month
|
Cycle Index
(Trend Value=100)
|
Remark
|
|
2019-09
|
99.6863
|
(p)
|
(P): Predicted by leading indicator from Jan 2019 to Apr 2019
|
|
2019-08
|
99.7356
|
(p)
|
|
2019-07
|
99.7607
|
(p)
|
|
2019-06
|
99.7836
|
(p)
|
|
2019-05
|
99.7786
|
(f)
|
Forecast based on the actual value of the Composite Index of Leading Indicators
|
|
2019-04
|
99.7630
|
(f)
|
|
2019-03
|
99.7711
|
(f)
|
|
2019-02
|
99.8824
|
(f)
|
|
2019-01
|
99.9938
|
(f)
|
|
2018-12
|
100.1057
|
(a)
|
The actual value of the Coincident Composite Index
|
|
Source: Business Cycle Forecasting Team, CDRI
|
| |
|
a
|
(actual)
|
|
|
|
f
|
(forecasted)
|
|
|
|
p
|
(predicted)
|
|
Business Cycle Composite Index for Taiwan Service Sector
Business Cycle Composite Index for Taiwan Service Sector
Source: Business Cycle Forecasting Team, CDRI
Previous cycle:
|
|
Cycle
|
Trough
|
Peak
|
Trough
|
|
1
|
2003/7
|
2004/10
|
2005/3
|
|
2
|
2005/3
|
2008/3
|
2009/8
|
|
3
|
2009/8
|
2011/8
|
2013/7
|
|
4
|
2013/7
|
2015/2
|
2017/4
|
|
(Business Cycle Indicator System is designed, instructed and analysed by professor Tain-Tsair Hsu)