The Commerce Development Research Institute (CDRI) released the Business Cycle Coincident Composite Index for Taiwan Service Industry today (5th September). It is predicted that the economic growth will continue to decline but at a slower pace owing to stronger business investment.
As the sub-indicators of all leading indicators have shown that the “Private Real Fixed Capital Formation” continues moving upwards. The improvement of trade deficit in the service industry remains contained. Nonetheless, “Real GDP of Transportation & Warehousing”, “Net Rate of Employment Increment in the Service Industry” and “Case of First-time Unemployment Benefit Claims” have all worsened continuously.
The Business Cycle Coincident Composite Index began to fall since the beginning of 2018. And the pace accelerated in the second half of 2018, culminating in the first half of 2019. Yet the falling pace is outlooked to slow down.
According to sub-indicators, the wholesale & retail sector and finance & insurance sector have decreased modestly, with the latter at a faster rate than the former.
In contrast, the real estate sector and residential services sector have increased slightly.
Further, although the number of people employed in the service sector during this period was only a bit lower than the long-term trend, the leading indicator of employment has already shown signs of worsening, which might have negative impact on the economy in the near future. In short, a comprehensive stimulus package is strongly recommended.
Amid the current global political and economic instability, factors including long-term productivity stagnation in the era of post-globalization, the impotence of “debt-driven” economy, insufficient global demand, protectionism, the US-China trade war that will lead to long-term tech war, the reshuffling of manufacturing supply-chain, the impact of exacerbated discrepancy among countries in the digital economy development have all contributed to further volatility, uncertainty, complexity, ambiguity (VUCA).
The return of formerly foreign-based Taiwanese investors and the relocation of their production sites have been commencing the new opportunity of value transformation yet representing a big challenge of value creation. In fact, only a “value-driven” public policy instead of the “debt-driven” approach, effective digital transformation and new business models could break through the productivity bottleneck and hence resolve the plights of limited market and weak purchasing power. Indeed, these are all what Taiwan’s relatively sluggish service industry urgently needs. Whereas, the conventional expansionary fiscal and monetary policies would show their limits on performance.
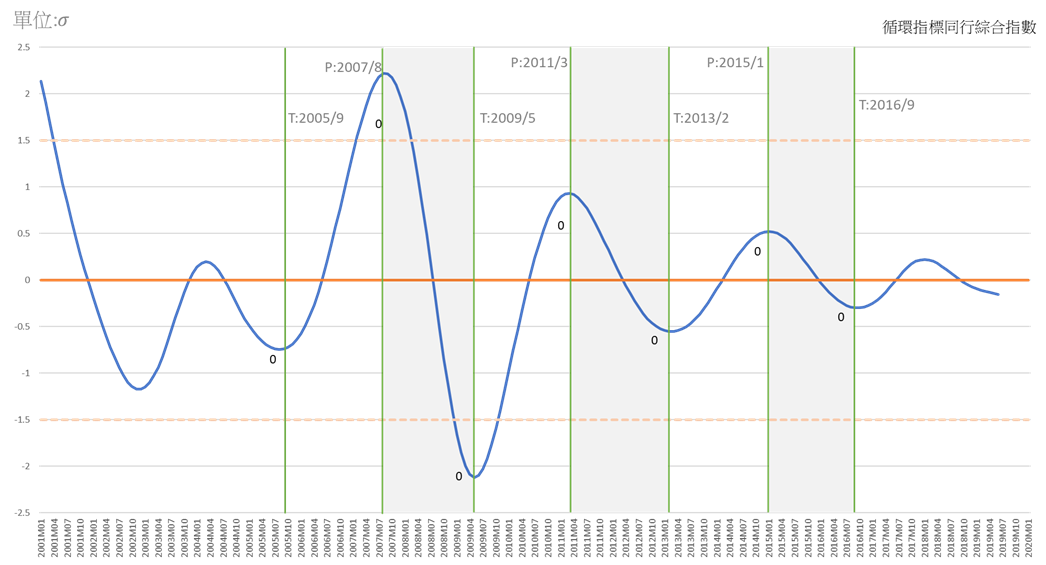
The Cyclical Fluctuations and Forecasts of Business Cycle Coincident Composite Index
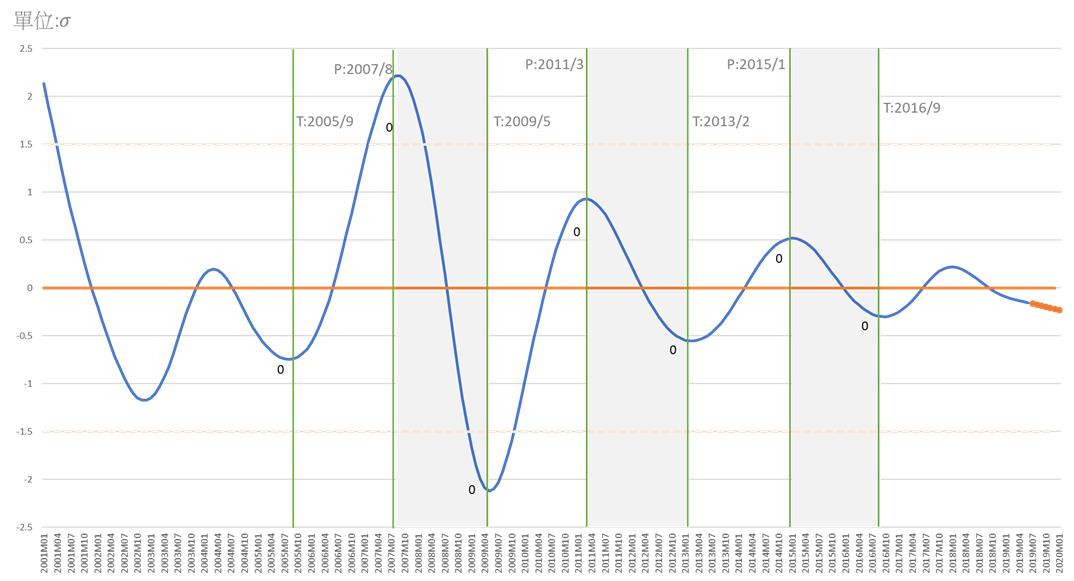
Note: Shaded area represents slowdown or recession in service growth as determined from trend-adjusted measures of aggregate sale and employment. The dates are recognized as the reference cycles.
Explanation: According to the past indication, upward indicates a rise in the economy (recovery), downward indicates a decline (slow or recession), between zero and 1.5 σ indicates recovery, above 1.5 σ indicates prosperity; between zero and negative 1.5 σ indicates sluggishness or decline, and less than 1.5 σ indicates depression.
A. Cyclical Leading Composite Index for Service Industries (long-term trend excluded) The actual value peaked in July 2018 and then fell all the way until July 2019. However, the latest rate of decline is milder comparing with those in the past. The reason is due to that the “Private Real Fixed Capital Formation” stopped declining and instead started moving upward since February 2018, and also the trade deficit of service sector has narrowed since 2017. Although other sub-indicators including "Transportation & Warehousing", as well as “Employment" and "Stock Market Index for Commercial Service Industry" all decreased since beginning of 2018 and the second half of 2018, respectively, the declining scale of Business Cycle Coincident Composite Index for Taiwan Service Sector is discernibly slower comparing to the past cyclical downturns. Yet the volatile domestic and foreign markets suggests still the difficulty to see the service industry bouncing back.
B. The economic outlook regarding Taiwan’s service industry is not positive, with all sub-indicators of all sectors showing descending trend apart from that of "Real GDP of Transportation & Warehousing”. Since February 2018 the Business Cycle Coincident Composite Index began to fall and accelerated its speed in the second half of 2018 reaching its peak in the first half of 2019. Yet it is forecasted that the pace of decline in the second half of 2019 will slow down. Further, the actual value statistics of second quarter this year outperformed expectation, implying that the general economic outlook is not as pessimistic as previously thought. Nevertheless, at this moment there is no sign of an imminent economic recovery. The Deviation of Standardized Composite Indicators represented as the Units of Standard Deviation demonstrated the peak of 0.22 standard deviation (σ) in February 2018, which fell to a negative 0.02 standard deviation (σ) in October the same year followed by a negative 0.15 standard deviation (σ) in June 2019. And it is estimated to drop to a negative 0.23 standard deviation (σ) in January 2020. This suggests that the economy will continue the downward trend. Therefore, stimulus measures should be further implemented as soon as possible despite the latest milder decline.
Business Cycle Coincident Composite Index for Taiwan Service Industry
|
Year/Month
|
Deviation of Standardized Cycle Indicators
(Unit: σ, Benchmark: 0)
|
Remark
|
|
2020-01
|
-0.2325
|
(p)
|
Prediction based on the lead effect for six months of the ARMA Model:(4,0) (0,0)
|
|
2019-12
|
-0.2214
|
(p)
|
|
2019-11
|
-0.2097
|
(p)
|
|
2019-10
|
-0.1977
|
(p)
|
|
2019-09
|
-0.1861
|
(p)
|
|
2019-08
|
-0.1749
|
(p)
|
|
2019-07
|
-0.1644
|
(e)
|
The estimated value of the coincident composite index
|
|
2019-06
|
-0.1536
|
(a)
|
The actual value of the coincident composite index
|
|
2019-05
|
-0.1436
|
(a)
|
|
2019-04
|
-0.1333
|
(a)
|
|
Source:Business Cycle Forecasting Team, CDRI
|
| |
|
a
|
(actual)
|
|
|
|
e
|
(estimated)
|
|
|
|
p
|
(predicted)
|
Business Cycle Composite Index for Taiwan Service Industry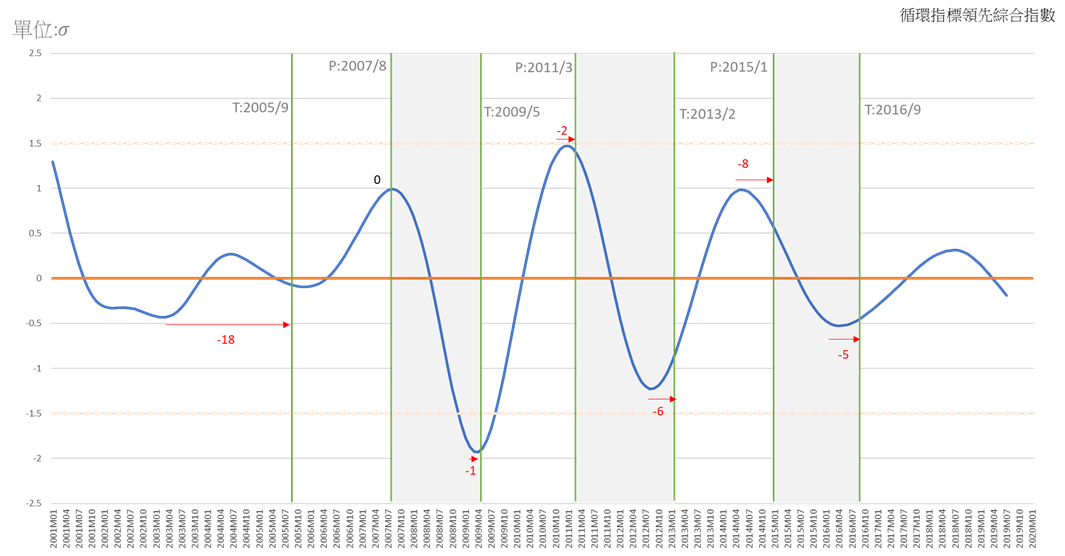
Source: Business Cycle Forecasting Team, CDRI
|
Cycle
|
Trough
|
Peak
|
Trough
|
|
1
|
2005/9
|
2007/8
|
2009/5
|
|
2
|
2009/5
|
2011/3
|
2013/2
|
|
3
|
2013/2
|
2015/1
|
2016/9
|
(Business Cycle Indicator System is designed, instructed and analyzed by Professor Tain-Tsair Hsu)