The Commerce Development Research Institute (CDRI) released the Business Cycle Coincident Composite Index for Taiwan Service Industry today (5th November). It is predicted that the economic slowdown will continue until March next year. The economic outlooks among industries will stay divergent, and the aggregated demand will hardly rebound and persist to decline at a slower pace.
Among the sub-indicators of all leading indicators, the “Private Real Fixed Capital Formation” continues moving upwards. The“Trade Deficit in the Service Industry” remains shrunk. Nonetheless, the “Real GDP of Transportation & Warehousing”, the “Net Rate of Employment Increment in the Service Industry”, the “Case of First-time Unemployment Benefit Claims” and the“TAIEX for Service Industry” have all moved downwards continuously.
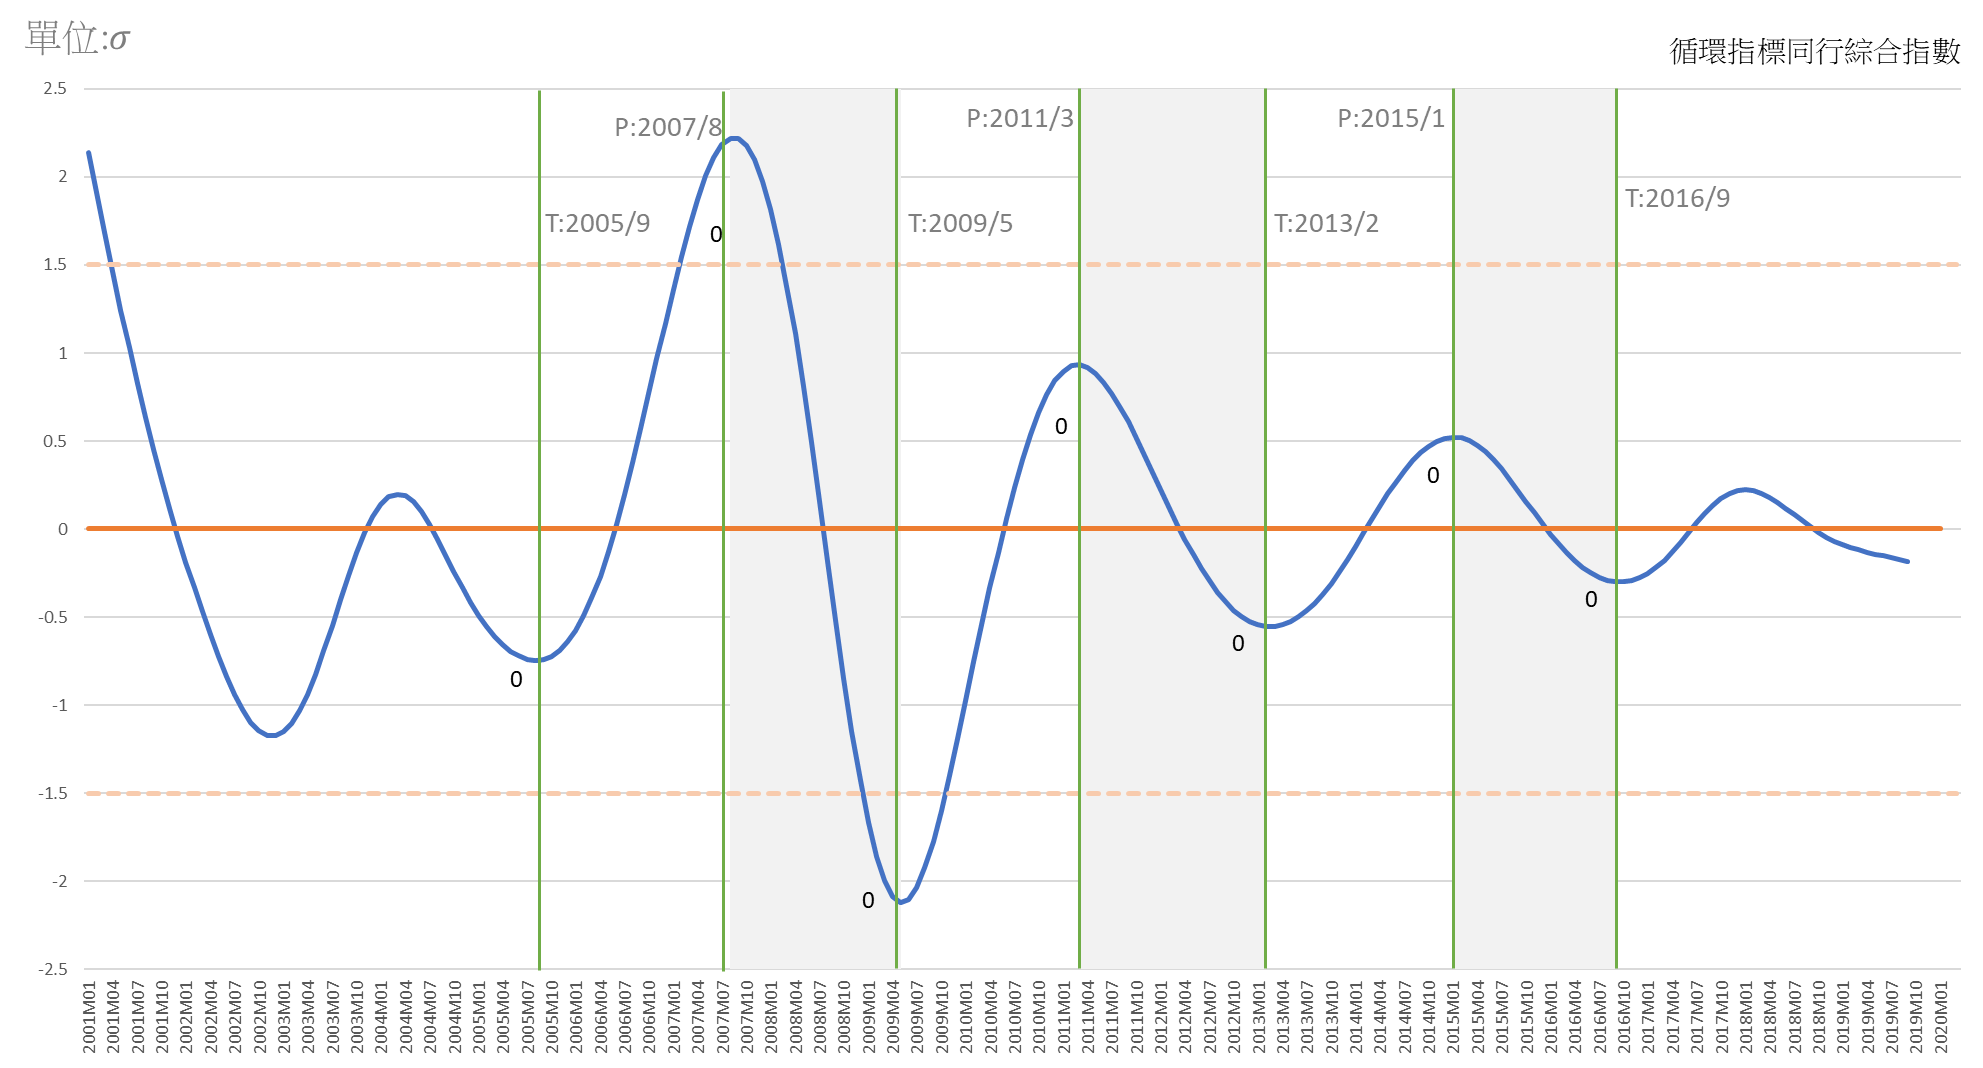
The Business Cycle Coincident Composite Index began to fall since the beginning of 2018, and then fell faster in the second half of 2018, and the falling peaked in the first half of 2019. It is forecasted that the index will continue falling at a slower rate from October 2019 until March 2020.
Meanwhile the sub-indicators of the cyclical coincidental composite move in different directions. Both of “Wholesale & Retail Sector”and“Finance & Insurance Sector” have decreased modestly at constant rate, but the latter at a faster rate than the former.
Whereas the “Real Estate Sector and Residential Services Sector”keeps increasing moderately and slightly accelerating.
Moreover, the number of people employed in the service sector has decreased a bit. Its cyclical index was already a bit below 100 (the long-term trend).
The economic outlook of each sector remains divergent, indicates the complexity and divergency of the market structure and the consumer behavior. The CDRI therefore suggests that it is better to adopt “precision” policies business model and strategy. At the same time it is recommended to utilize cross-industry marketing system integration and internet service platform to assist SMEs conducting “digital transformation”, which can create new and bigger market and increase added-value with “Smart Business Service” and “precision strategy” of the business model.
The Fluctuations and Forecasts of Cycle Coincident Composite Index
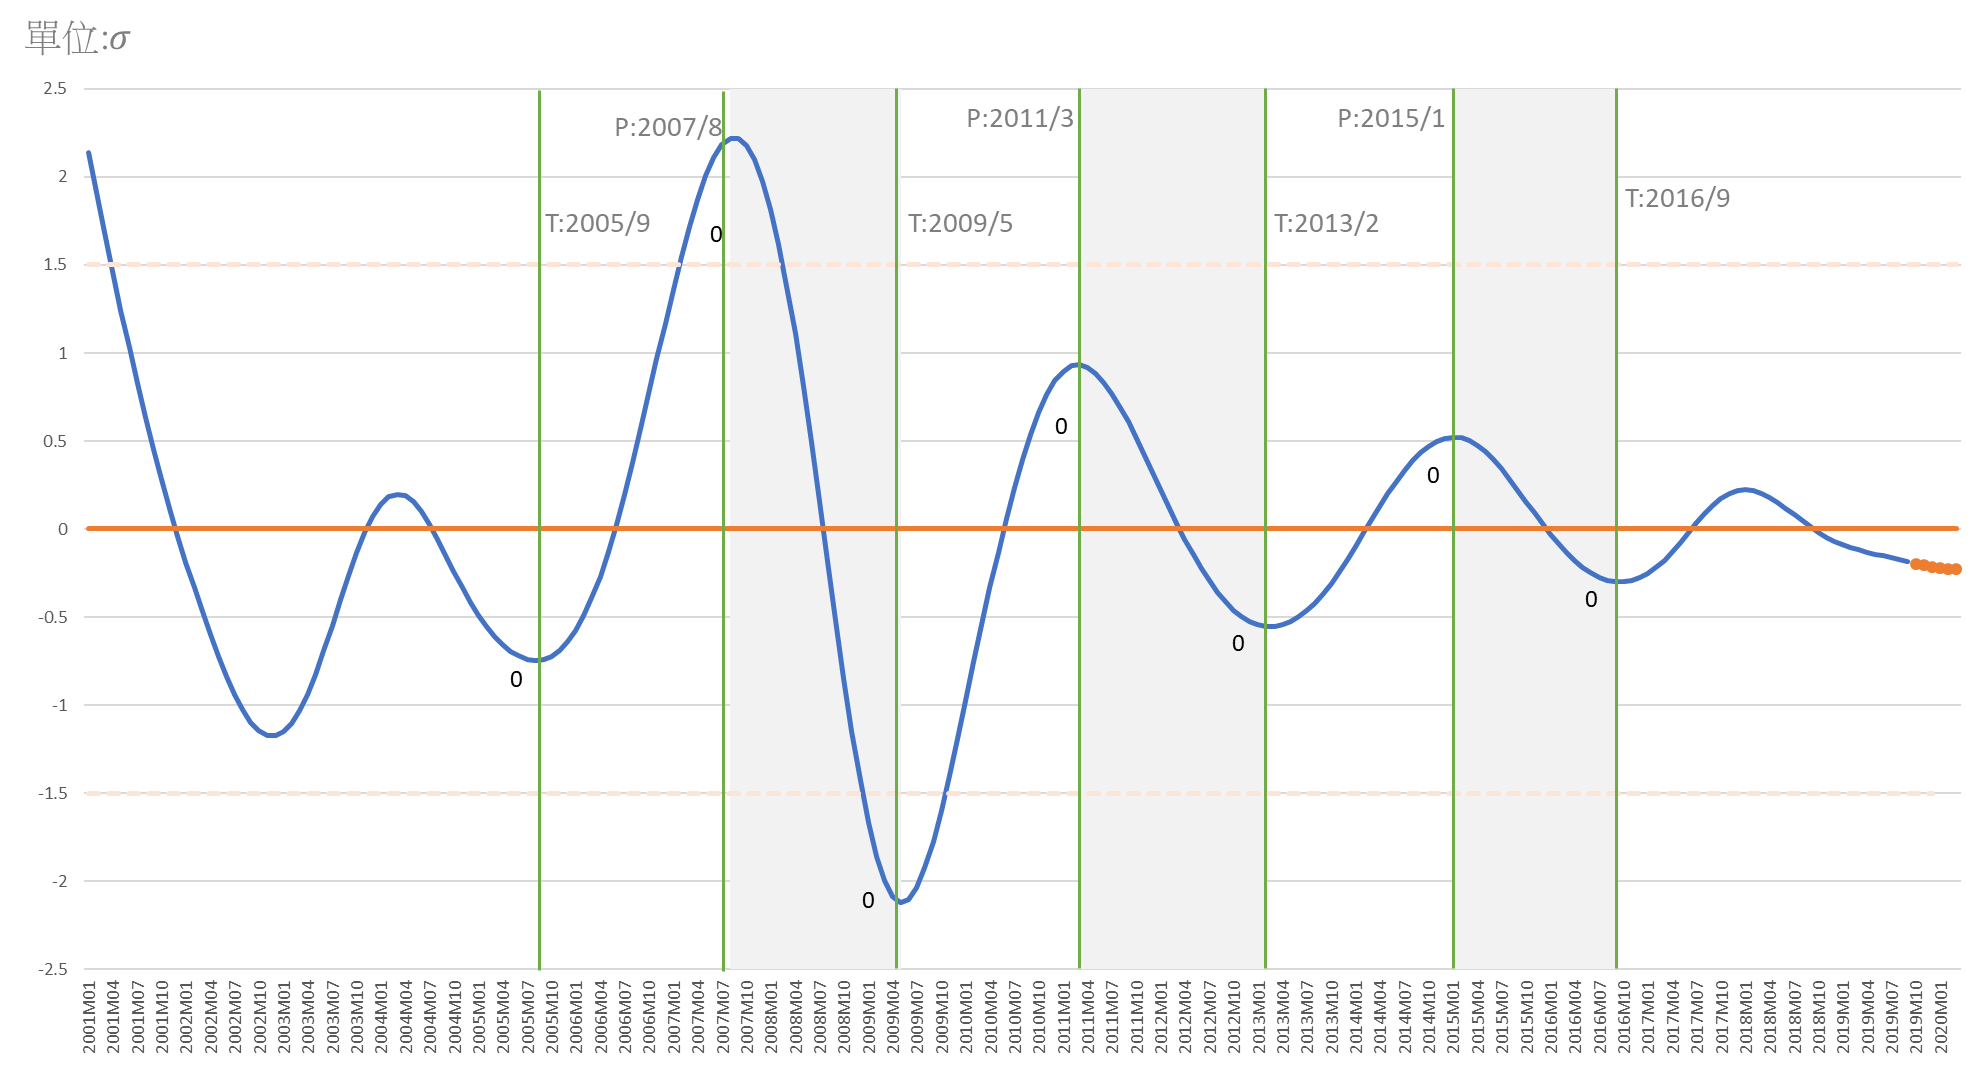
Note: Shaded area represents slowdown or recession in service growth as determined from trend-adjusted measures of aggregate sale and employment. The dates are recognized as the reference cycles.
Explanation: According to the past indication, upward indicates a rise in the economy (recovery), downward indicates a decline (slow or recession), between zero and 1.5 σ indicates recovery, above 1.5 σ indicates prosperity; between zero and negative 1.5 σ indicates sluggishness or decline, and less than 1.5 σ indicates depression.
Business Cycle Coincident Composite Index for Taiwan Service Industry
|
Year/Month
|
Deviation of Standardized Cycle Indicators
(Unit: σ, Benchmark: 0)
|
Remark
|
|
2020-03
|
-0.2251
|
(p)
|
Prediction based on the lead effect for six months of the ARMA Model:(4,0) (0,0)
|
|
2020-02
|
-0.2250
|
(p)
|
|
2020-01
|
-0.2216
|
(p)
|
|
2019-12
|
-0.2154
|
(p)
|
|
2019-11
|
-0.2070
|
(p)
|
|
2019-10
|
-0.1972
|
(p)
|
|
2019-09
2019-08
2019-07
|
-0.1864
-0.1752
-0.16403
|
(e)(e)
(e)
|
The estimated value of the coincident composite index
|
|
2019-06
|
-0.15302
|
(a)
|
The actual value of the coincident composite index
|
|
Source:Business Cycle Forecasting Team, CDRI
|
|
a (actual)
|
|
e (estimated)
|
|
p (predicted)
|
Business Cycle Composite Index for Taiwan Service Industry
Chart 1. Cyclical Leading Composite Index
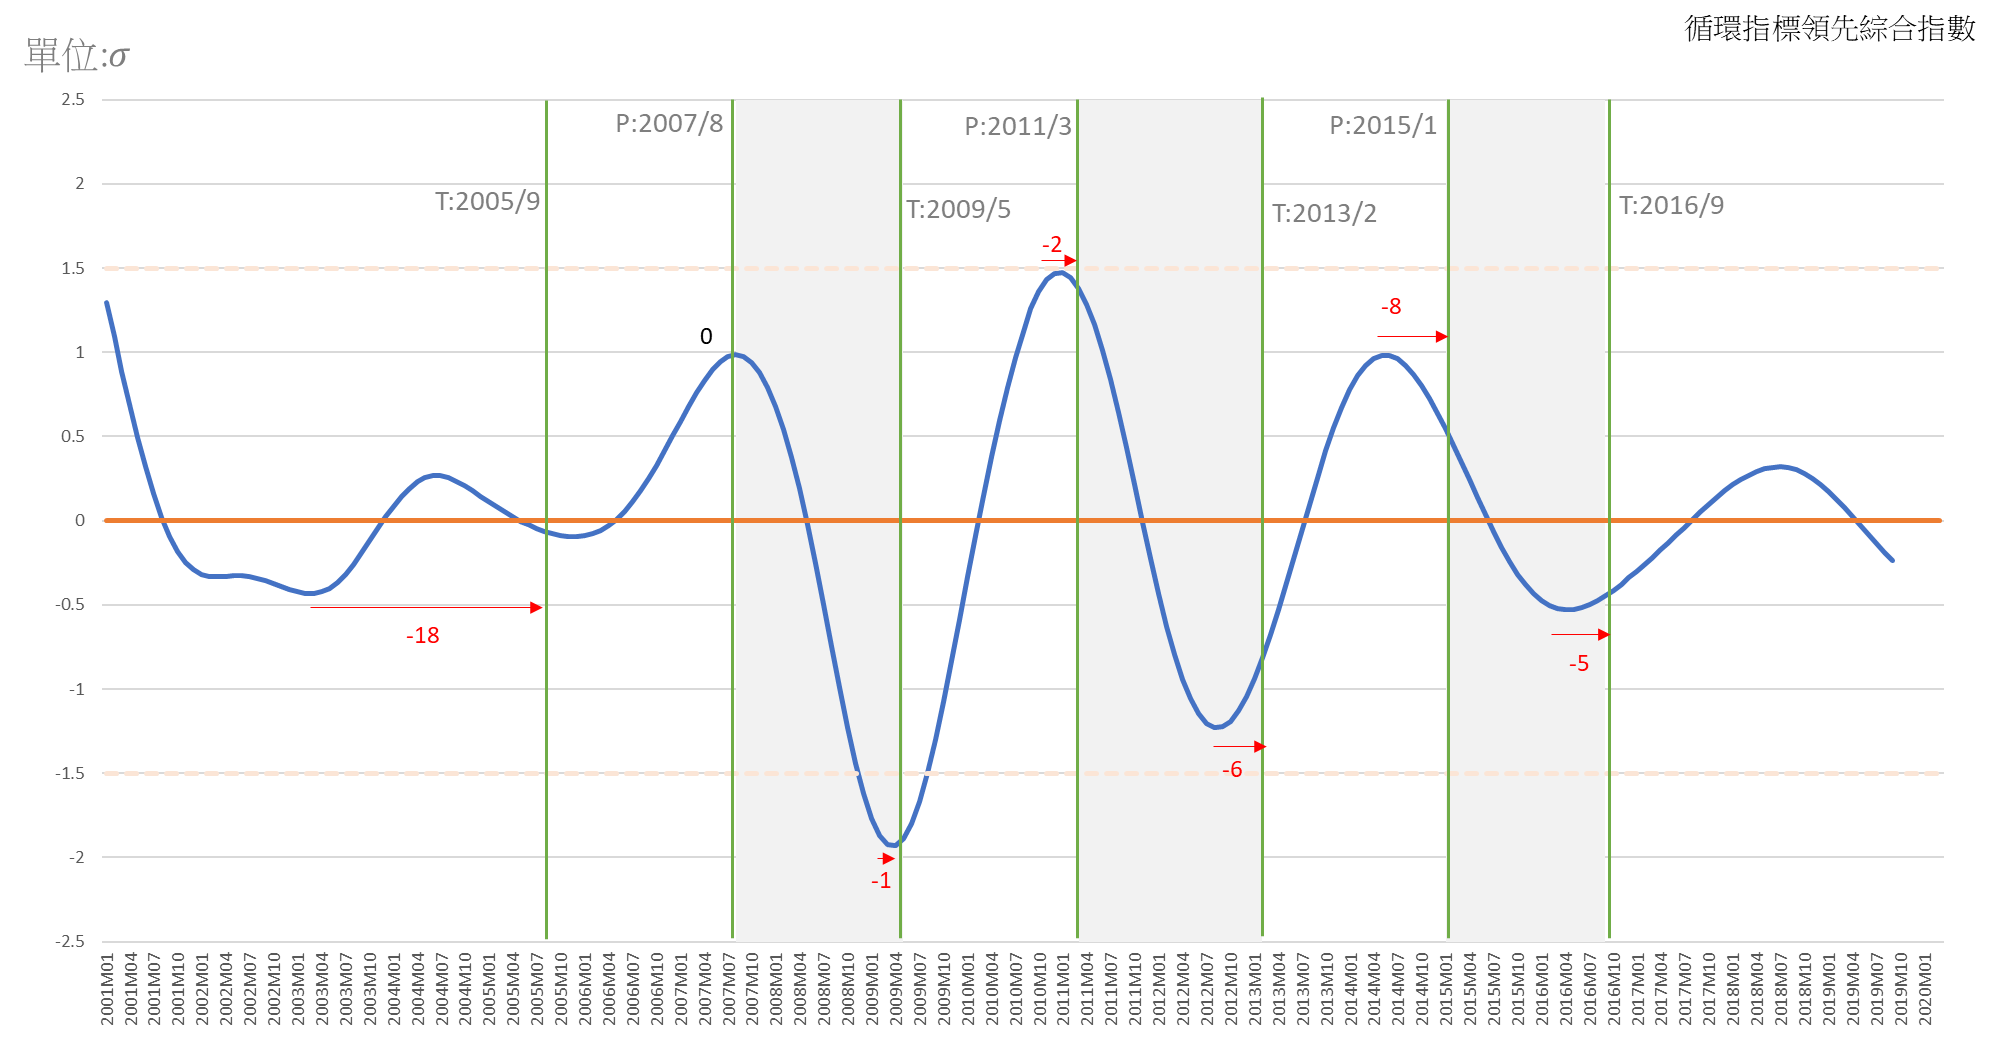
Source: Business Cycle Forecasting Team, CDRI
Chart 2. Cyclical Coincident Composite Index
|
Cycle
|
Trough
|
Peak
|
Trough
|
|
1
|
2005/9
|
2007/8
|
2009/5
|
|
2
|
2009/5
|
2011/3
|
2013/2
|
|
3
|
2013/2
|
2015/1
|
2016/9
|
Table: The Reference Cycle of Taiwan’s Service Industry
(Business Cycle Indicator System is designed, instructed and analyzed by Professor Tain-Tsair Hsu)