Authors: Tain-Tsair Hsu(許添財), Shin-Hsien Chen(陳世憲)
【Abstract】
I. Current Trends and Outlook of the Commercial Service Industry
1. The Commerce Development Research Institute (CDRI) Commercial Service Industry Business Cycle Indicator System analysis shows that the Coincidental Cyclical Composite Index for Service Industry (CCCIS) reversed its decline since Q2 2024 and turned upward in January 2026, driven solely by the exceptionally strong recovery in the Wholesale and Retail Industry. The standardized CCCIS stood at 0.0125 Standard Deviations and is forecast to continue rising to 0.2299 Standard Deviations by October this year.
Among the five sub-indicators, only one is rising. A comparison of the standardized long-term trend values shows that the Real GDP Index of Wholesale and Retail Industry stands out with a continuous and robust growth, reaching a cyclical index of 4.1725 Standard Deviations. The Real Consumption of Residential Services, Utilities, and Other Fuel Industries has reversed from an increase to a decline, with a cyclical index of -0.6203 Standard Deviations. The remaining three sub-indicators continue to decline; however, the downward pace for both the Real GDP of the Accommodation and Catering Industry and the Real Estate and Residential Service Industry has slowed down significantly, with cyclical indexes at -0.7091 and -1.1570 Standard Deviations, respectively. Meanwhile, the sub-indicator for Employment in the Service Sector continues to drop, with its cyclical index falling to -1.2089 Standard Deviations.
2. The Leading Cyclical Composite Index for Service Industry (LCCIS), which guides the cyclical trends of the Commercial Service Industry, reached 0.3555 Standard Deviations in April 2026, showing a significantly accelerated growth rate in Q1 2026.
A closer examination of the cyclical indexes for the seven sub-indicators reveals that four are declining while three are rising, indicating that the divergence driving this uneven recovery persists.
In this period, Private Real Fixed Capital Formation resumed growth, the Number of the Initial Acceptance of Unemployment Benefits (inverted) turned downward, and the Net Entry Rate of Employees in the Commercial Service Industry continued to decrease. This reflects a new pattern of corporate asset reallocation, where investment momentum is strengthening while employment growth is weakening.
As for the other sub-indicators, the Real GDP of Finance and Insurance Sector continued to rise, but the Stock Price Index of the Commercial Service Industry kept falling; the Transportation and Storage Industry’s real GDP continued to decline, while the Net Trade in Service Revenue and Expenditure kept increasing.
3. In summary, the normalization of this uneven recovery clearly indicates that the business cycle pattern has shifted due to structural changes in industries and markets.
II. Key Highlights and Policy Implications
(I) Key Highlights of Current Business Cycle Changes
1. The simultaneous rise in both the LCCIS and the CCCIS gives a strong impression that the economic recovery is getting back on track. The economic growth rate in Q1 2026 reached a 48-year single-quarter high of 14.55%. In terms of sectoral contributions to economic growth, Net Exports contributed a striking 10.33 percentage points, which is widely recognized because of robust exports driven by booming demand for AI and high-performance computing.
2. However, a detailed look at the sub-indicators in the system reveals that four out of the seven leading sub-indicators continue to decline. Furthermore, among the five coincidental sub-indicators, only the Wholesale and Retail Industry shows strong growth, while all others continue to slide. Based on the Diffusion Index used to evaluate business cycles, it’s premature to call this a sustained economic recovery.
3. In terms of GDP growth and contribution, the Industry Sector shows strength while the Service Sector remains weak; exports are booming while domestic demand appears weak. This highlights the paradox of a dual economy and unbalanced K-shaped development. This indicator system further demonstrates extreme divergence among sub-indicators within the Service Sector. In short, disparities exist not only between the Industry Sector and the Service Sector, but also between domestic and foreign demand, as well as among different industries within the Service Sector, pointing to market fragmentation and structural divergence.
(II) Policy Implications
1. The normalization of an uneven recovery and extreme divergence in economic trends are undoubtedly driven by rapid and drastic changes in economic and market structures. Future policies should combine supply-side reforms with demand-side support to help businesses and investors realize returns on their asset reallocation amid new market competition.
2. Taiwan has gained a rare, once-in-a-century position as a core hub in the “AI Era.” However, traditional small and medium-sized enterprises are struggling to realize the actual benefits of digital, green, and AI transformations. The opportunities are already there, waiting for the government, enterprises, and experts to join forces and swiftly deploy solutions.
3. The normalization of an uneven recovery and the highly polarized trends across sectors and industries demonstrate that structural factors significantly affect supply chain resilience, consumer behavior, and market structures.
Figure 1. “Tendencies and Forecasts of the Coincidental Cyclical Composite Index for the Service Industry”
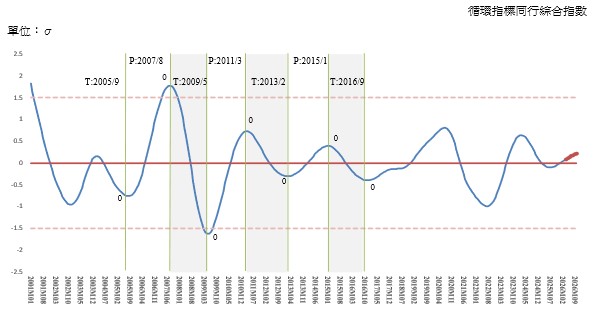
Source: Business Cycle Forecasting Team, CDRI
III. Q1 2026 GDP Growth Rate and Contribution Analysis
According to the Directorate-General of Budget, Accounting and Statistics, the annual economic growth rate for Q1 2026 reached 14.55%. The structural analysis by expenditure and industry is as follows:
- By expenditure sector, the unprecedented 14.55% growth rate was driven predominantly by Net Exports, which contributed a striking 10.33 percentage points. This was followed by Private Consumption at 2.16 percentage points, and Private Investment at 1.36 percentage points (see Table 1 below).
- By industry sector, the Industry Sector contributed 9.22 percentage points to growth, while the Service Sector contributed 4.61 percentage points. The Industry Sector continues to maintain a significant relative advantage (see Table 2 below).
- The strong alignment between high export contributions and robust industrial growth perfectly demonstrates how the booming AI era has fully unleashed dividends for Taiwan’s supply chain.
Table 1. Economic Growth Rate and Contribution by Expenditure Sector, Q1 2026
Unit: %; percentage points
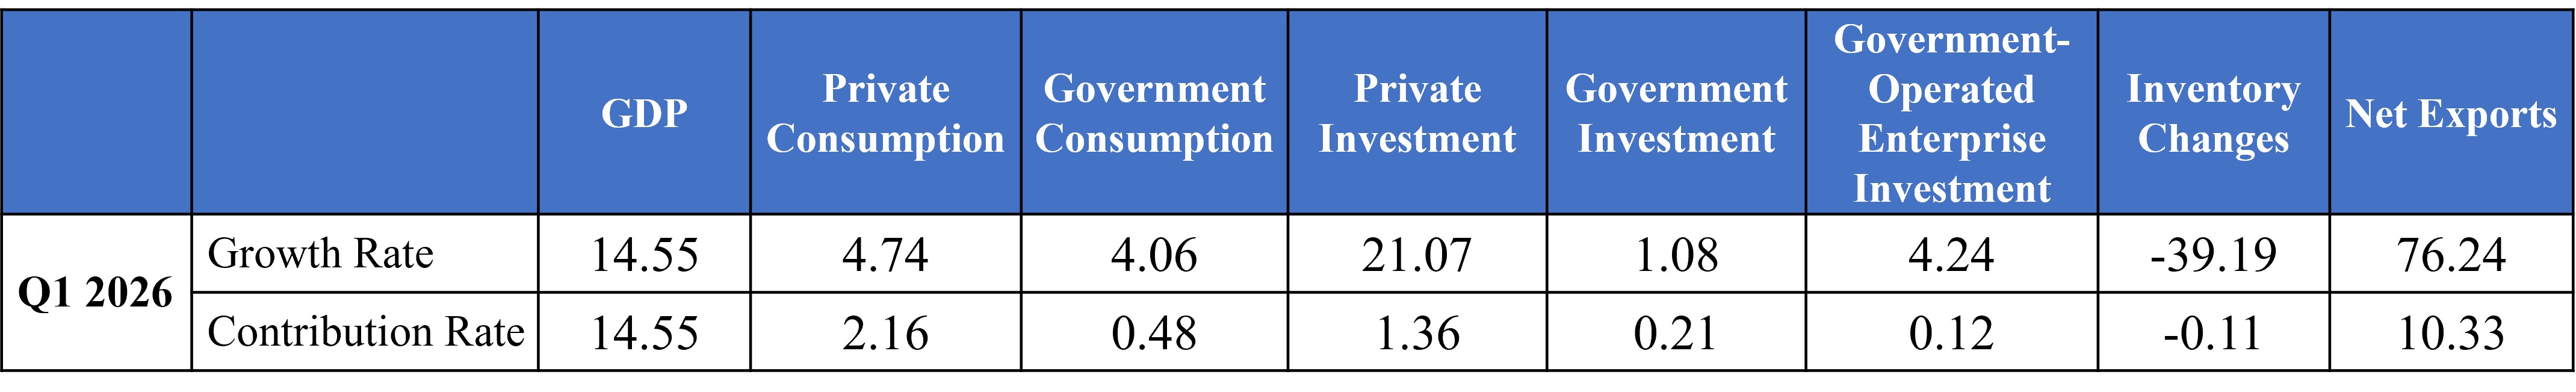
Source: Directorate-General of Budget, Accounting and Statistics, Executive Yuan.
Table 2. Economic Growth Rate and Contribution by Industry Sector, Q1 2026
Unit: %; percentage points
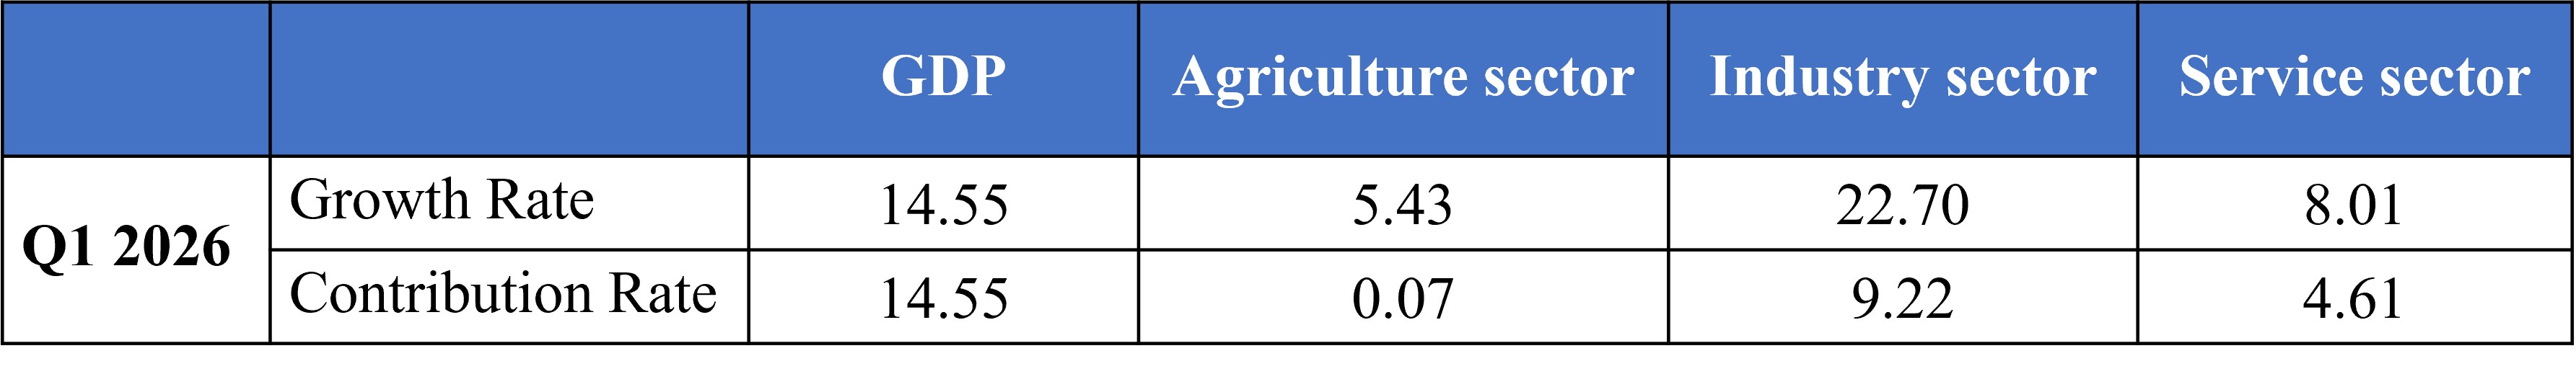
Source: Directorate-General of Budget, Accounting and Statistics, Executive Yuan.
Figure 2. Leading and Coincidental Cyclical Composite Index for the Service Industry
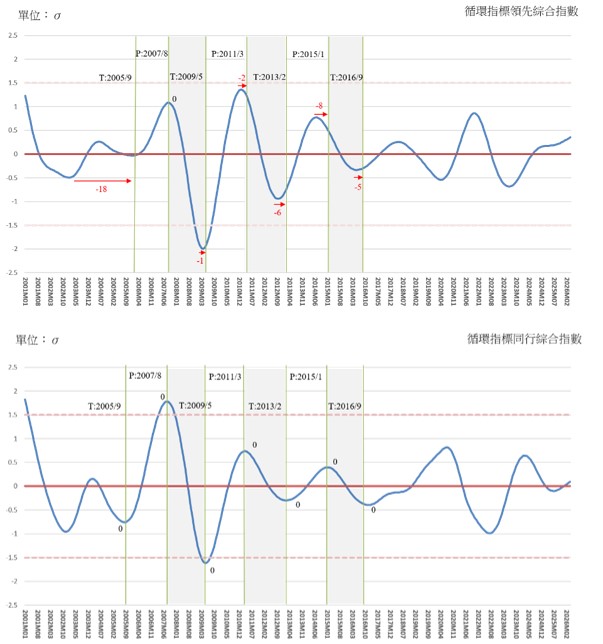
Source: Business Cycle Forecasting Team, CDRI
IV. Cyclical Trends of Composite Index Sub-indicators
A. Leading indicator series (seven sub-indicators)
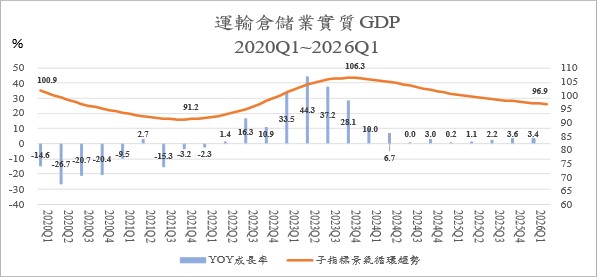
a. The business cycle trend for the Real GDP of Transportation and Storage Industry has declined for 30 consecutive months as of April 2026. Although the decline has slowed since H2 last year, a short-term recovery remains unlikely.
The standardized cyclical trend value has dropped to -1.1630 Standard Deviations. The actual year-on-year growth rate also remains sluggish, fluctuating between 3.0% and 3.4% over the past six quarters. This stands in sharp contrast to the previous five quarters (from Q2 2023 to Q2 2024), where the growth rate gradually fell from 44.3% to 6.7%. This severe stagnation in the business cycle highlights an urgent need for counter-recession measures. Following 30 consecutive months of decline, the cyclical trend value for this indicator reached 96.43 in April 2026, remaining below the long-term trend value (100) for 14 months.
Figure 3. The annual growth rate of Transportation and Storage GDP and business cycle trend, 2020Q1~2026Q1
Source: Business cycle trends from the CDRI Forecasting Team; YoY growth rates calculated by the authors from DGBAS GDP statistics.
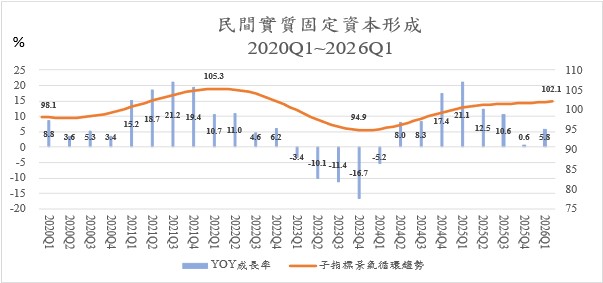
b. The cyclical trend value for Private Real Fixed Capital Formation reversed its decline and turned upward in Q1 2026. In a positive sign, the actual year-on-year growth rate also rose from 0.6% in Q4 2025 to 5.8%. Reaching 102.17 in April this year, this trend value translates to a standardized cyclical change index of 0.6656.
Standard Deviations, indicating a gradual recovery. Additionally, the actual YoY growth rate turned positive in Q2 2024, ending five consecutive quarters of negative growth, and climbed quarterly to a peak of 21.1% in Q1 2025. It then decelerated, growing by 12.5% and 10.6% in Q2 and Q3 respectively, slowing to 0.64% in Q4 last year, before rebounding to 5.8% in Q1 this year.
Figure 4. Annual growth rate and cyclical trend of Private Real Fixed Capital formation, 2020Q1~2026Q1
Source: Business cycle trends from the CDRI Forecasting Team; YoY growth rates calculated by the authors from DGBAS GDP statistics.
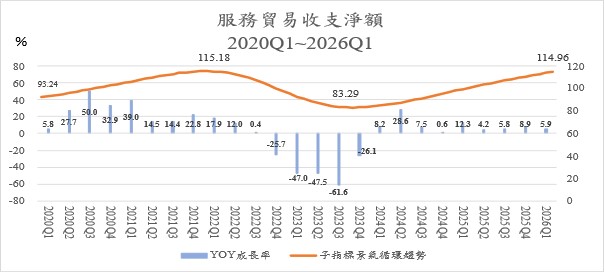
c. Net Trade in Service Revenue and Expenditure registered a rare historic surplus during the pandemic but returned to its traditional deficit format in Q1 2023. An improving service trade deficit signals a healthier Service Sector. This cyclical trend value hit a trough in October 2023 and has climbed steadily since. The actual YoY growth rate also “improved” from -61.6% (a deficit of US$3.913 billion) in Q3 2023 to 8.2% in Q1 2024, and surged to 28.6% in Q2 2024. Subsequent quarters fluctuated between 8.9%, 0.6%, and -2.2%, settling at 5.9% (a deficit of US$3.423 billion) in Q1 this year. Overall, the cyclical trend value rose steadily from its trough of 83.12 in October 2023 to 116.00 in April 2026.
Figure 5. Annual growth rate and cyclical trend of net trade in Services Revenue and Expenditure, 2020Q1~2026Q1
Source: Business cycle trends from the CDRI Forecasting Team; YoY growth rates calculated by the authors from DGBAS GDP statistics.
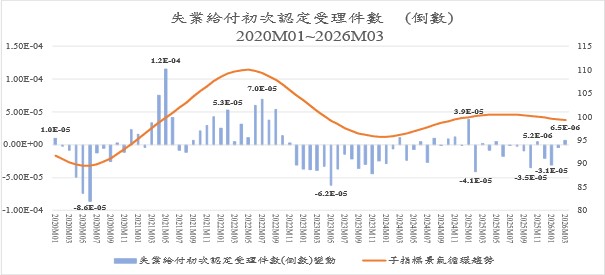
d. The inverted trend for the Number of the Initial Acceptance of Unemployment Benefits (inverted) shifted from a rise to a decline in Q1 this year, signaling easing labor demand pressures or a smaller labor shortage.
While the unemployment rate lags the business cycle, initial unemployment claims lead the unemployment rate, meaning inverted claims can serve as a leading indicator. Since employment is a coincident indicator, the inverted initial claims can lead employment trends. This indicator’s cyclical trend dropped to 99.07 in April this year, confirming a cooling labor demand, while the standardized cyclical index fell further to -0.0355 Standard Deviations.
Figure 6. Number of the initial acceptance of unemployment benefits (inverted) and the annual growth rate and cyclical trend January 2020 to March 2026
Source: Business cycle trends from the CDRI Forecasting Team; YoY growth rates calculated by the authors from DGBAS GDP statistics.
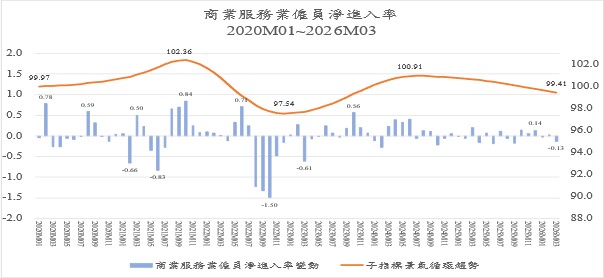
e. The cyclical trend for the Net Entry Rate of Employees in the Commercial Service Industry peaked and turned downward in July 2024. Its standardized index reached -0.2773 Standard Deviations in April 2026, indicating a continued contraction in commercial service employment.
This trend previously bottomed out in December 2022 and climbed to a peak of 100.94 in July 2024 before reversing downward with accelerating declines, hitting a trend value of 99.31 in April 2026.
Figure 7. Annual changes and cyclical trends in the net entry rate of Employees in the Commercial Service Industry, January 2020 to March 2026
Source: Business cycle trends from the CDRI Forecasting Team; YoY growth rates calculated by the authors from DGBAS GDP statistics.
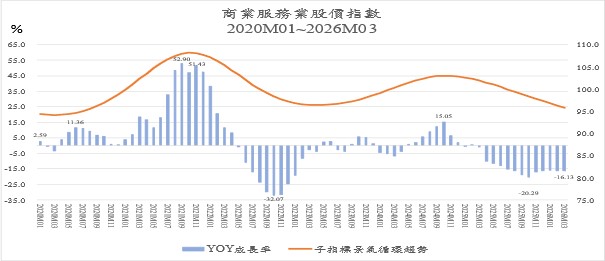
f. The cyclical trend for the Stock Price Index of the Commercial Service Industry peaked in October 2024 and has since declined for 18 consecutive months through April 2026 with an accelerating downward pace. With a trend value of 95.23 and a standardized index of -0.9428 Standard Deviations, this indicator clearly signals an impending recession for the Commercial Service Industry.
Meanwhile, the actual YoY stock index grew positively from May to December 2024, peaking at 15.1% in October before slowing down. It has entered negative territory since last year, worsening to -20.3% in October last year, before moderating slightly to -16.13% in April 2026, confirming a clear cyclical downturn.
Figure 8. The annual growth rate and circular trend of the Stock Price Index of the commercial service industry, January 2020 to March 2026
Source: Business cycle trends from the CDRI Forecasting Team; YoY growth rates calculated by the authors from DGBAS GDP statistics.
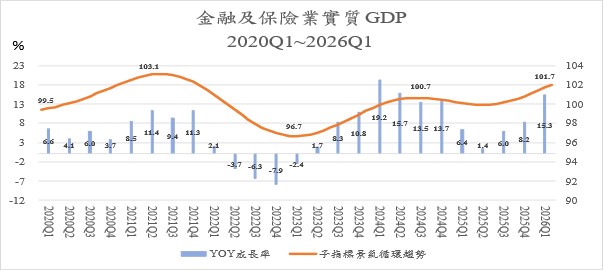
g. The actual YoY growth rate for the Real GDP of Finance and Insurance Sector returned to positive territory in Q2 2023, quickly hitting a growth peak of 19.2% in Q1 2024. It then cooled quarterly to single-digit growth last year, hitting a low of 1.4% in Q2 before recovering slightly to 6% and 8.2% in Q3 and Q4. In Q1 this year, growth rebounded strongly to 15.3%. The cyclical trend value stood at 102.32 as of April 2026, with its standardized cyclical index bouncing back to 1.5996 Standard Deviations.
Figure 9. Annual growth rate and cyclical trend of real GDP of Finance and Insurance Sector, 2020Q1~2026Q1
Source: Business cycle trends from the CDRI Forecasting Team; YoY growth rates calculated by the authors from DGBAS GDP statistics.
B. Coincident indicator series (five sub-indicators)
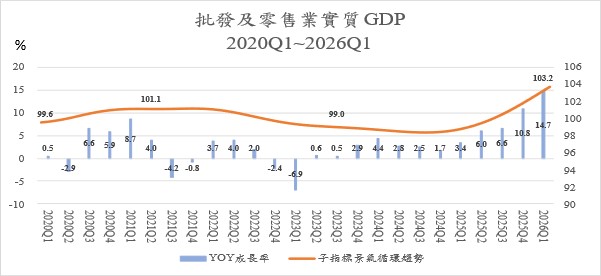
a. The Real GDP Index of Wholesale and Retail Industry remains an exceptional standout. Both its cyclical trend and actual values continue to rise, strengthening further in Q1 2026. Its standardized cyclical trend value climbed to 4.1725 Standard Deviations.
This trend value reached 104.23 in April 2026, indicating a steady and remarkably fast expansion. Driven by consecutive quarterly gains throughout last year, the actual annual growth rate further surged to 14.7% in Q1 this year.
Figure 10. Annual growth rate and cyclical trend of real GDP Index of Wholesale and Retail, 2020Q1~2026Q1
Source: Business cycle trends from the CDRI Forecasting Team; YoY growth rates calculated by the authors from DGBAS GDP statistics.
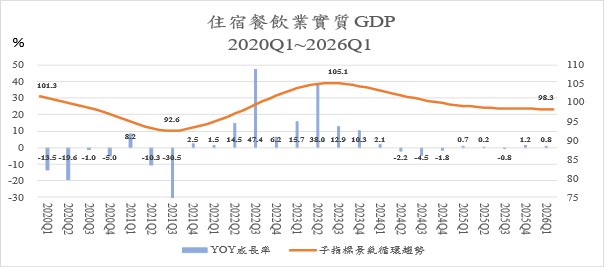
b. The cyclical trend for the Real GDP of the Accommodation and Catering Industry has declined for 33 consecutive months as of April 2026, showing a persistent downturn despite a slight deceleration in its drop rate. After turning negative in Q2 2024, the actual growth fluctuated modestly. Although it ticked up by 1.2% in Q4 last year and 0.8% in Q1 this year, these gains failed to reverse the broader cyclical decline, leaving the standardized trend value slightly lower at -0.7091 Standard Deviations.
In April 2026, the trend value fell further to 98.33, marking its 18th consecutive month below the long-term trend value (100) and confirming the absence of a genuine recovery signal. Similarly, the actual annual growth rate has shown no stable recovery trend, fluctuating between -4.5% and 1.2% since hitting a negative 2.2% in Q2 2024.
Figure 11. The annual growth rate and circular trend of real GDP in the Accommodation and Catering Industry, 2020Q1~2026Q1
Source: Business cycle trends from the CDRI Forecasting Team; YoY growth rates calculated by the authors from DGBAS GDP statistics.
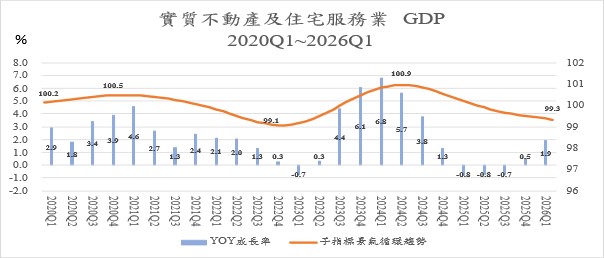
c. The cyclical movement for the Real GDP of Real Estate and Residential Service Industry peaked in May 2024 and has since declined for 23 consecutive months through April 2026, though the pace of decline has moderated slightly. Its trend value stood at 99.30 in April 2026, translating to a standardized value of -1.1570 Standard Deviations. During the same period, the actual annual growth rate fell quarterly from a peak of 6.8% in Q1 2024, with the decline accelerating into Q3 last year to hit -0.7%. Although growth turned positive in Q4 last year, it was a meager 0.5% before edge-up slightly to 1.9% in Q1 this year.
Figure 12. Annual GDP growth rate and cyclical tendency of Real Estate and Residential Service Industry, 2020Q1~2026Q1
Source: Business cycle trends from the CDRI Forecasting Team; YoY growth rates calculated by the authors from DGBAS GDP statistics.
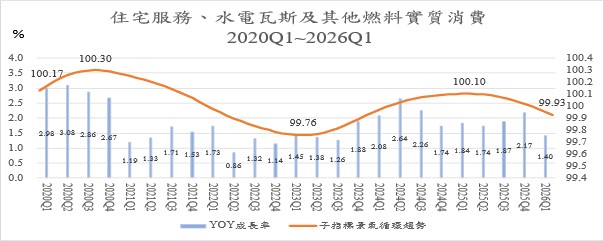
d. The long-term cyclical trend for the Real Consumption of Residential Services, Utilities, and Other Fuel Industries has remained relatively stable. However, its trend value slipped below the long-term trend value (100) in Q1 2026, dipping to 99.90 in April. This represents a significant drop when standardized to -0.6203 Standard Deviations.
Meanwhile, the actual annual growth rate has remained positive every quarter since 2020 but with limited momentum, fluctuating between a peak of 3.08% (Q2 2020) and a low of 0.86% (Q2 2022). After hitting a recent high of 2.64% in Q2 2024, it trended downward below 2%, rebounded briefly to 2.17% in Q4 last year, and dropped again to 1.4% in Q1 this year.
Figure 13. Real Consumption of Residential Services, Utilities, and Other Fuel Industries, 2020Q1~2026Q1
Source: Business cycle trends from the CDRI Forecasting Team; YoY growth rates calculated by the authors from DGBAS GDP statistics.
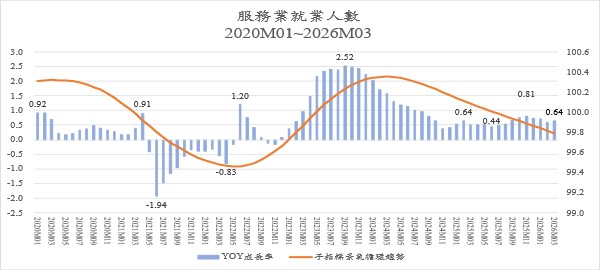
e. The cyclical trend for The Number of Employees in the Service Industry peaked in March 2024 and has since reversed downward for 25 consecutive months.
By April this year, the trend value dropped to 99.77, with its standardized value worsening to a clearly visible downturn of -1.2089 Standard Deviations. Standing at -1.2089 Standard Deviations in April 2026, the severity of this indicator outpaces the -0.7091 seen in the accommodation and catering sector, trailing only the real estate and residential service sector’s -1.1570.
In terms of actual annual growth, a continuous expansion since December 2022 peaked at 2.52% in September and October 2023, before slowing down to 0.4% by November and December 2024. Last year, it fluctuated between 0.44% and 0.81% after a February high of 0.64%, and stood at 0.64% in Q1 this year. This highlights concerns that labor shortages are capping employment growth amidst the economic recovery, reinforcing a clear cyclical downturn.
Figure 14. The growth rate and cyclical tendency of The Number of Employees in the Service Industry, January 2020 to March 2026
Source: Business cycle trends from the CDRI Forecasting Team; YoY growth rates calculated by the authors from DGBAS GDP statistics.
C. Lagged indicator series
The lagged indicator includes Real Consumption of Tobacco and Alcohol, Real Consumption of Clothing, Footwear, and Apparel, Real Consumption of Furniture, Equipment, and Housekeeping, and the Number of Initial Recognition and Acceptance of Unemployment Benefits. The Lagged Index can be used as a reference for observing whether a business cycle is over. This article omits relevant analysis.
Appendix
Business Cycle Coincident Composite Index for Taiwan Service Sector
|
Year/Month
|
Deviation of Standardized Cyclical Coincident Composite Index
(Unit: σ, Benchmark: 0)
|
Remark
|
|
2026-10
|
0.2299
|
(P)
|
Use ARMA Model: (4,0)(0,0) to make predictions based on the leading effect set for half year
|
|
2026-09
|
0.2135
|
(P)
|
|
2026-08
|
0.1942
|
(P)
|
|
2026-07
|
0.1722
|
(P)
|
|
2026-06
|
0.1481
|
(P)
|
|
2026-05
|
0.1224
|
(P)
|
|
2026-04
|
0.0954
|
(f)
|
The estimated value of the Coincident Composite Index
|
|
2026-03
|
0.0679
|
(a)
|
The actual value of the Coincident Composite Index
|
|
2026-02
|
0.0401
|
(a)
|
|
2026-01
|
0.0125
|
(a)
|
|
Source: Business Cycle Forecasting Team, CDRI
Note:
1. (a): actual; (f): estimated; (p): predicted.
2. The most recent reference cycle turning point: September 2016 (trough).
3. Leading indicator sub-indicators: (1) Real GDP of the Transportation and Storage Industry*, (2) Private Real Fixed Capital Formation*, (3) Net Balance of Trade in Services Revenue and Expenditure*, (4) Initial Acceptance of Unemployment Benefits (inverted), (5) Net Entry Rate of Employees in the Commercial Services Industry, (6) Stock Price Index of the Commercial Service Industry, (7) Real GDP of Finance and Insurance*.
4. Coincident indicator sub-indicators: (1) Real GDP of Wholesale and Retail Industry*, (2) Real GDP of Accommodation and Catering Industry*, (3) Real GDP of Real Estate and Residential Industry*, (4) Real Consumption of Residential Services, Utilities, and Other Fuel Industries*, (5) Number of Employees in the Service Industry.
5. Lagging indicator sub-indicators: (1) Real Consumption of Tobacco and Alcohol*, (2) Real Consumption of Clothing, Footwear, and Accessories*, (3) Real Consumption of Furniture, Equipment, and Household Maintenance*, (4) Initial Acceptance of Unemployment Benefits.
* Indicates that these indicators are calculated based on quarterly data and may require extrapolation due to data limitations.
|