Authors: Tain-Tsair Hsu(許添財), Shin-Hsien Chen(陳世憲)
【Abstract】
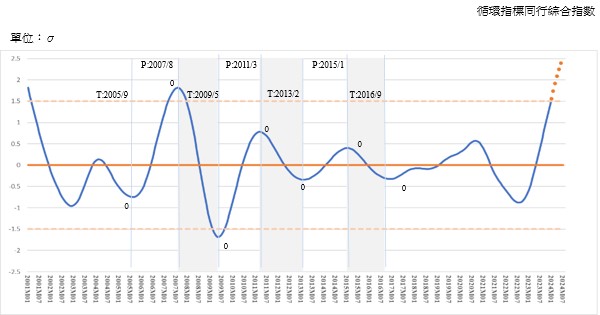
The CDRI business cycle indicator shows that Coincidental Cyclical Composite Index for Service Industry (CCCIS) in January 2024 has indicated a continuous recovery for 17 consecutive months, and has reached 1.5525 Standard Deviations after being standardized, with a stronger upward trend continously. It’s also predicted to sustain the momentum and reach 2.5136 Standard Deviations by July 2024 to enter the historical state of “prosperity.”
Among the five sub-indicators of this CCCIS, in terms of their cyclical tendency values, except for Wholesale and Retail at 99.94, all the rest has exceeded the long-term trend value of 100. In terms of the speed of cyclical tendency changes, except for a slight slowdown in the Accommodation and Catering Industry, currently at a point of 102.41, the others have been consistently accelerating, indicating a robust pace of recovery.
The Leading Cyclical Composite Index (LCCIS) continues to decline, but the rate of decline has significantly slowed down in H2 2023, which can mean a significantly reducing of the overall economic recovery’s uncertainty for the coming future.
In January 2024, the LCCIS reached -0.5591 Standard Deviations, which didn’t surpass the trough of -0.6066 Standard Deviations in April 2020 yet. However, among its seven sub-indicators, three of them have shown an improvement in economic recovery, with their cyclical tendency values surpassing the long-term trend value (100) and continuing to accelerate. These include Transportation and Storage Industry, Employment in the Commercial Service Industry, and the Finance and Insurance Industry, while the remaining four sub-indicators with continued deteriorating cyclical tendency, two of them have also shown a slowdown in the worsening tendency, including the Net Balance of Trade in Services Revenue and Expenditure and the Stock Price Index of the Commercial Service Industry. Only two sub-indicators, Private Real Fixed Capital Formation, and the Initial Acceptance of Unemployment Benefits (inverted) continued to deteriorate, indicating some limitations in the overall strength of economic recovery to some extent. Nonetheless, this may also suggest a potential alleviation for the current labor shortage pressures.
There are some key points and implications regarding the changes in Business Forecast for Taiwan’s Commercial Service Industry in Q1 2024 as follows:
1. The pace of economic recovery in the Commercial Service Industry is expected to remain robust. However, amidst the current economic vibrancy, the upward trend of severe labor shortages in the Accommodation and Catering Industry began to noticeably slow down since August 2023, which is likely to impose limitations on sustained growth to some degree, more importantly indicating that an imminent need for automation, digitalization, and even the substitution of manpower with robots to enhance productivity.
2. The declining trend in the LCCIS has been repeatedly showing significantly that there is a mitigating signal on reducing the overall risk of a continuous economic downturn. However, two sub-indicators, “Private Real Fixed Capital Formation” and “The Net Balance of Trade in Services Revenue and Expenditure,” experienced rapid declines in H2 2023, even entering a severe recession zone. There seems to resemble the previous structural scenario that led Taiwan’s economy into a prolonged period of so-called “stagnation” before the pandemic.
3. In the current era of the digital economy, Taiwan possesses a unique advantage with its cutting-edge semiconductor technology, and the capital accumulated during the period of globalization. These advantages present an opportunity to facilitate comprehensive economic transformation rapidly through “digital-driven” and “service-oriented” approach in resolving this longstanding issue. However, without breakthroughs in industrial structure, it’s still hard for the economy to depart from the long-term “low-level equilibrium” and “structural imbalance” trap even after a recovery. In short, these two factors are the basic causes for the export-oriented, backward countries in the world today to have been faced the long-term economic and social difficulties due to the low birth rates, low wages, and an aging population. Taiwan is uniquely positioned to lead in addressing these challenges. Moreover, there is currently a noticeable increase in the number of small and medium-sized enterprises displaying a greater ambition for innovative transformations than ever before. The trend of the second generation taking over and a renewed focus on sustainability has become prevalent. The advent of a highly promising economic era isn’t impossible.
1. Comprehensive analysis and prediction
CDRI finds that the Coincidental Cyclical Composite Index for Service Industry (CCCIS) has bottom out in August 2022 of -0.8791 Standard Deviation. However, as of January 2024, the index has steadily risen to a positive value of 1.5525 Standard Deviations. It’s predicted that the index will continue to steadily increase and reach 2.5136 Standard Deviation by July 2024. It’s clearly seen that the economic recovery in the Commercial Service Industry is visibly stable. (See Figure 1 and the appendix below)
Figure 1. “Tendencies and Forecasts of the Coincidental Cyclical Composite Index for the Service Industry”
Source: Business Cycle Forecasting Team, CDRI
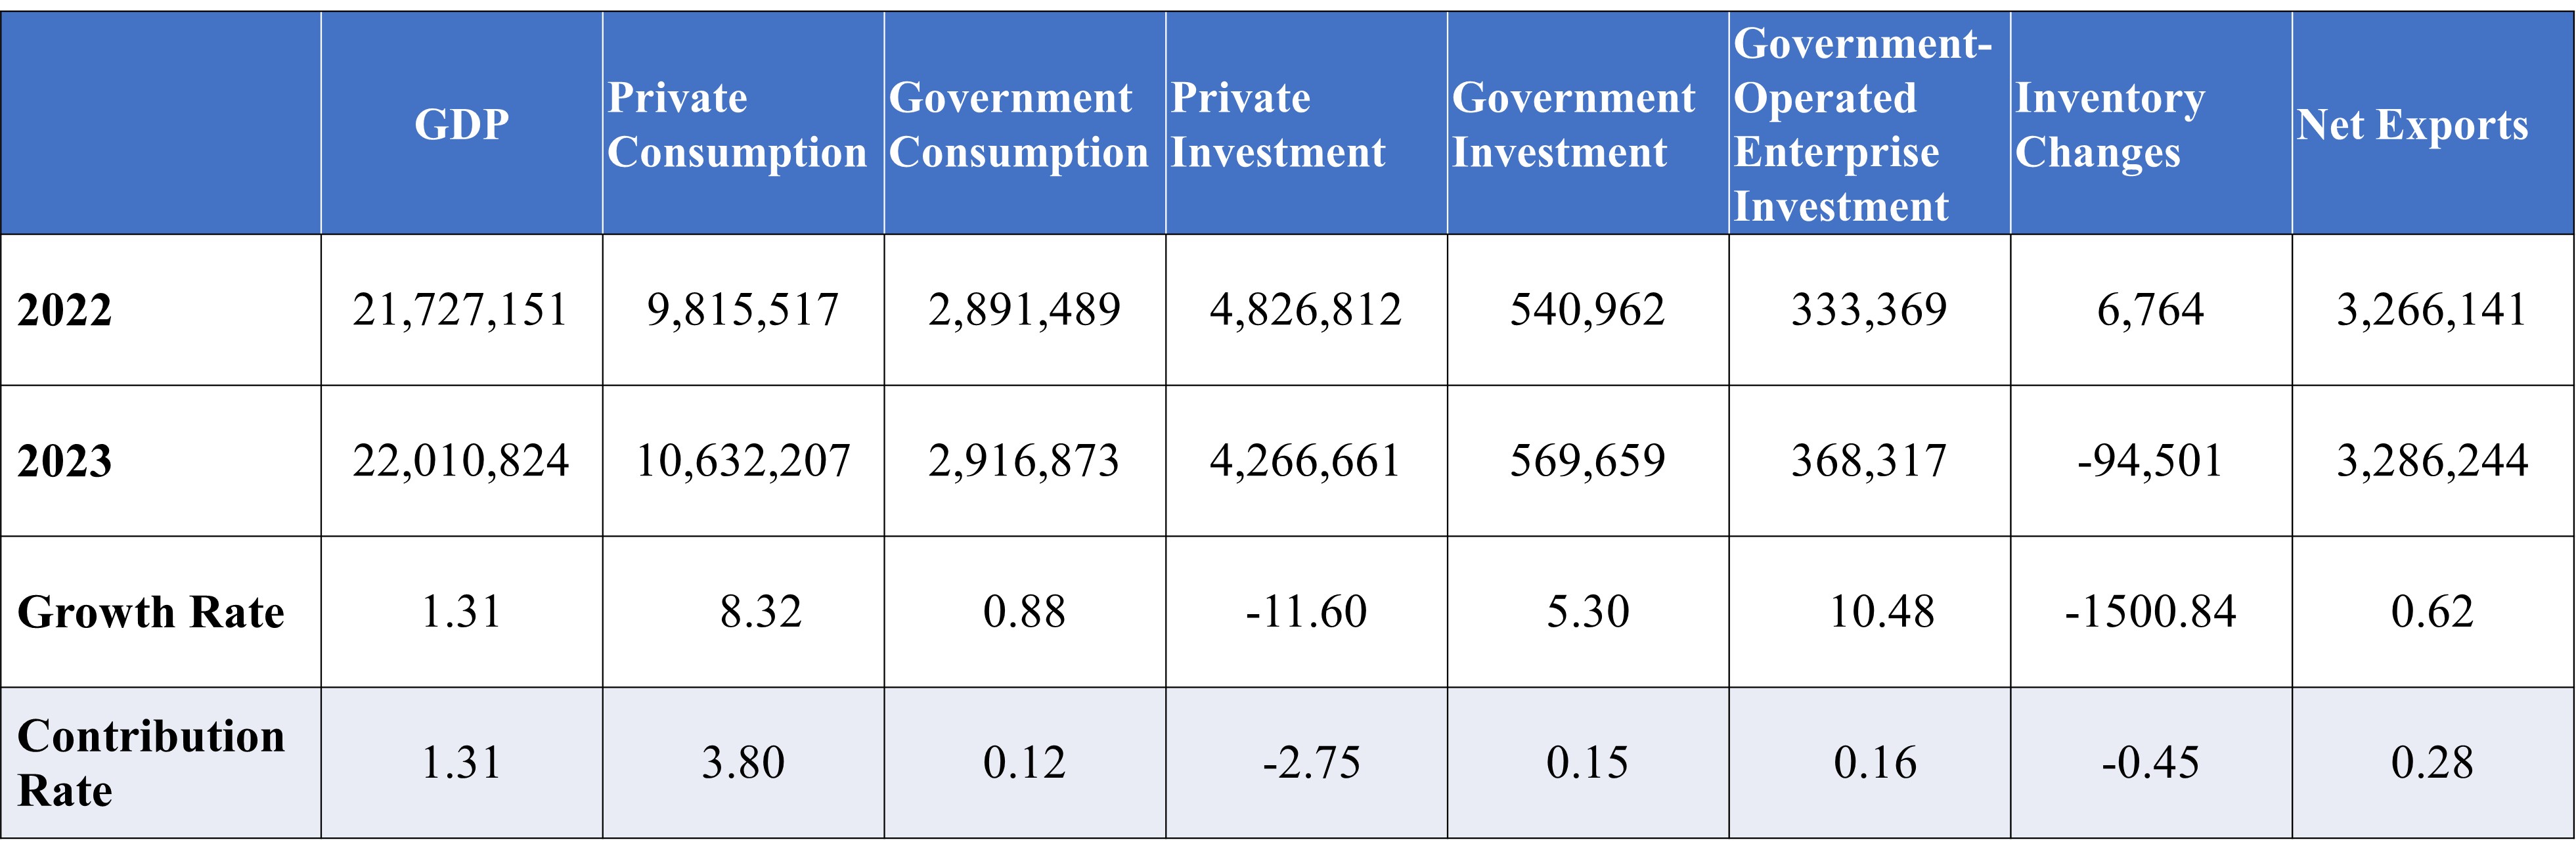
Based on the data provided by the Directorate General of Budget, Accounting and Statistics, Executive Yuan, the economic growth rate of last year reached 1.31%. The main momentum behind economic growth is Private Consumption, followed by the aggregate of Public Sector expenditure, including Government Consumption, Government Investment and Government-Operated enterprises. Net Exports rank third in importance. Private Investment, however, is experiencing a severe decline, exerting the most significant impact on overall economic growth.
From the perspective of GDP expenditure, the growth rate contribution of Private Investment reached -11.6%, and a contribution of -2.75%, making it the largest negative impact. The reduction in inventories has widened by 1500.84%, contributing -0.45% to economic growth, which has a secondary impact.
Private Consumption, which had the weakest growth contribution rate in the past, has not only reversed its growth rate but also emerged to the top position in terms of growth rate contribution, with a growth rate of 8.32% and a contribution of 3.8%. Net Exports grew by 0.62%, contributing 0.28% to economic growth. The annual growth rate of Government Consumption is 0.88%, contributing 0.12%. Government Investment grew by 5.3%, contributing 0.15%. Government-operated Enterprises Investment saw a growth rate of 10.48%, contributing 0.16%. In total, the combined contribution of Public Sector expenditures amounted to 0.43%. (See Table 2 below.)
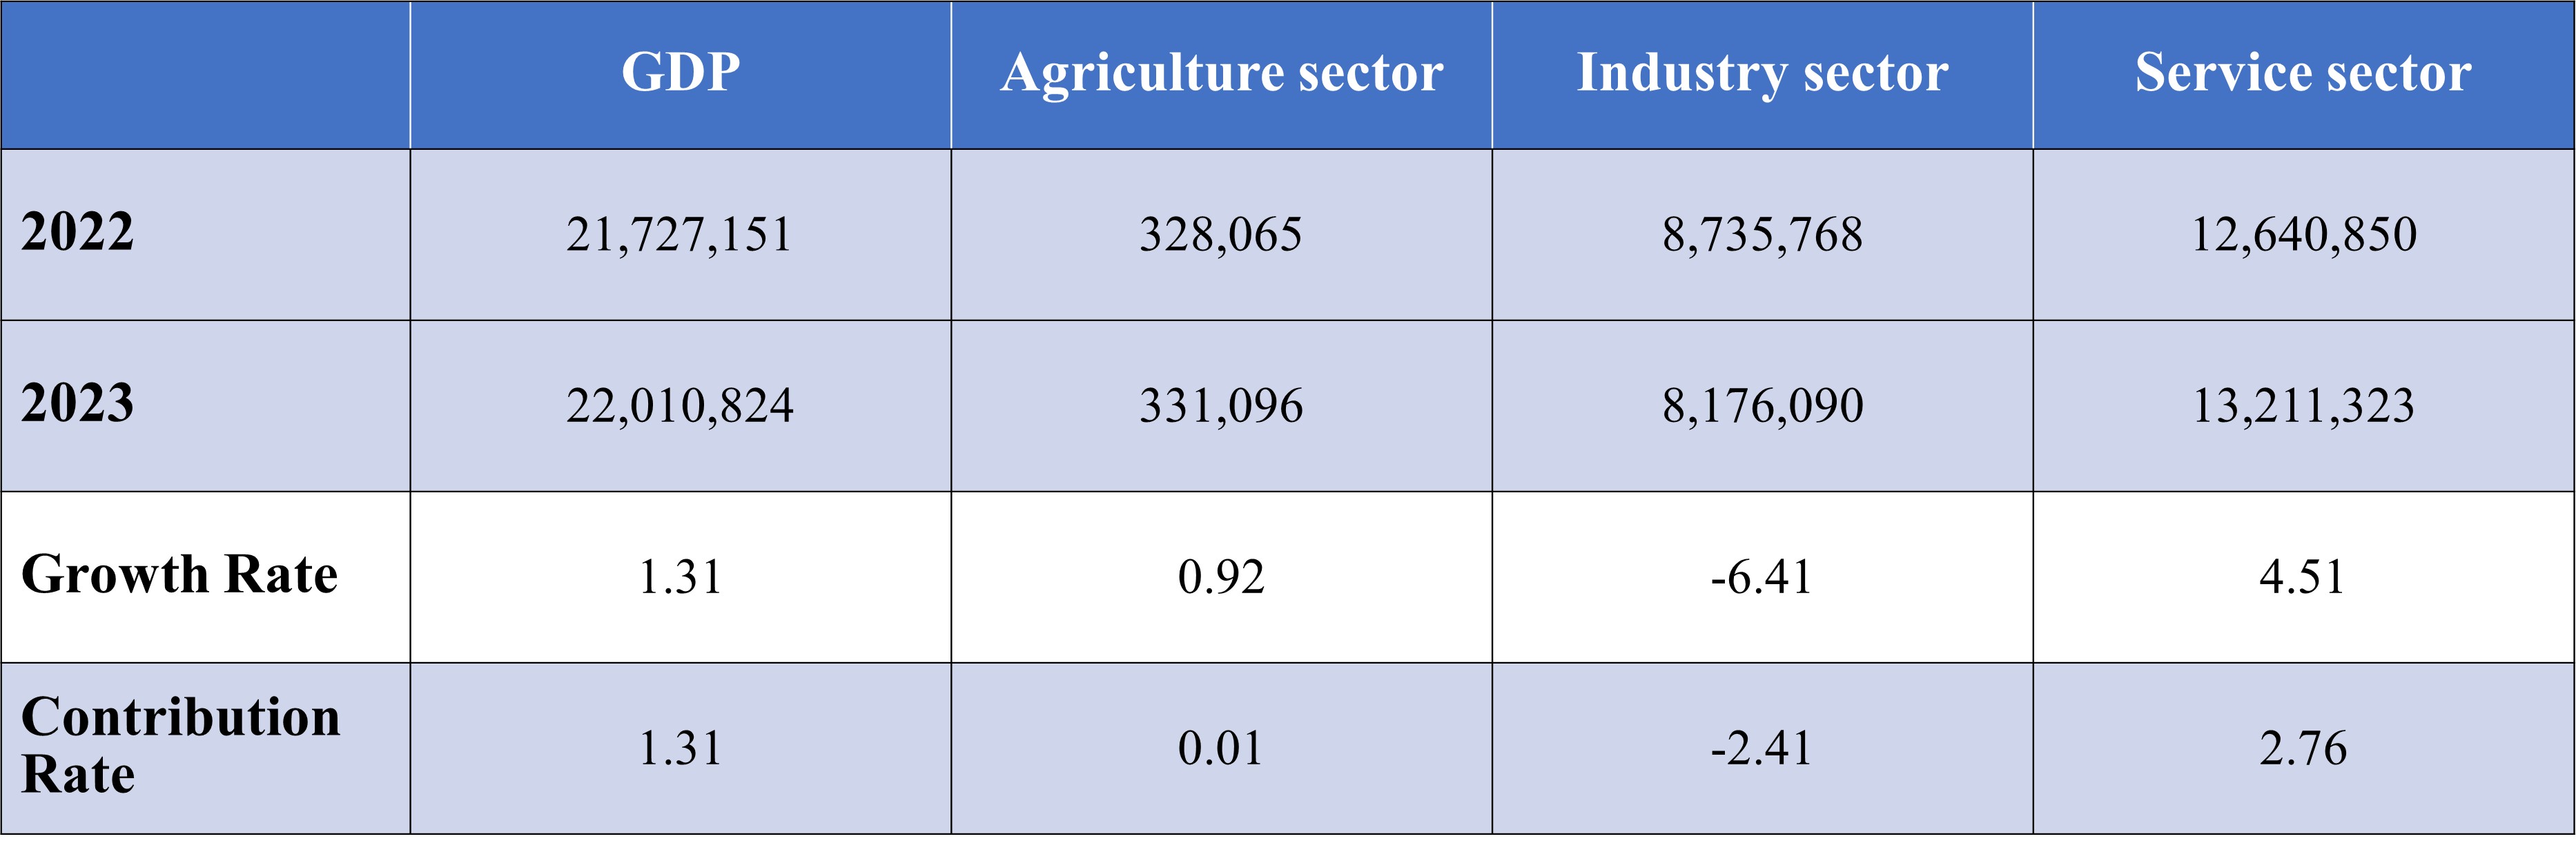
From the perspective of industry, the growth rate contribution in 2023 has also undergone major changes. The growth rate and contribution of the Service sector have surpassed all the rest sectors. The Service sector has a growth rate of 4.51% and a contribution of 2.76%. The Industrial sector has a growth rate of -6.41% and a contribution of -2.41%, while the Agriculture sector has a growth rate of 0.92% and a contribution of 0.1%. The overall economic decline is mainly attributed to a substantial decline in the Industrial sector, mainly in manufacturing.
Table 2. 2023 economic growth rate and growth contribution rate, by sector
Unit: Millions of New Taiwan Dollars; %
Source: Directorate-General of Budget, Accounting and Statistics, Executive Yuan, and the Business Cycle Forecasting Team of CDRI
Table 3. 2023 economic growth rate and growth contribution rate, by industry
Unit: Millions of New Taiwan Dollars; %
Source: Directorate-General of Budget, Accounting and Statistics, Executive Yuan, and the Business Cycle Forecasting Team of CDRI
Upon further examination of different sectors and industries, it is found that Private Enterprises have been suffering a severe decline in Investment, Manufacturing, and Exports, while Private Consumption of products and services is relatively prospering, resulting in a severe imbalance.
2. Service industry business cycle outlook
【Regarding the indicator system】
The business cycle Composite Index system on the Time Series Analysis. We analyze the relevant economic indicators in the time series and select indicators based on their significance to the business cycle and stability of their cyclicality. They are then classified into leading indicators, coincident indicators, and lagged indicators through the use of statistical analysis and verification.
The cyclical trend of the Composite Index of coincident indicators is shown to be highly correlated with the cyclical trend of the GDP, and the forecast value of the Composite Index of the coincident indicators, estimated by the Leading Indicator Composite Index, could be used to forecast the moving trends of the GDP.
The cyclical trend of economic indicators fluctuates around the long-term trend. The long-term trend value is normalized to 100; cyclical trend values greater than 100 indicate a recovery or prosperity stage while values below 100 indicate a recession or depression stage.
The standardized changes of the indicators’ cyclical trend values (in Standard Deviation units) are added up to become a Composite Index, and it fluctuates around the long-term trend value with a Standard Deviation of zero.
【Latest Indicator Trends】
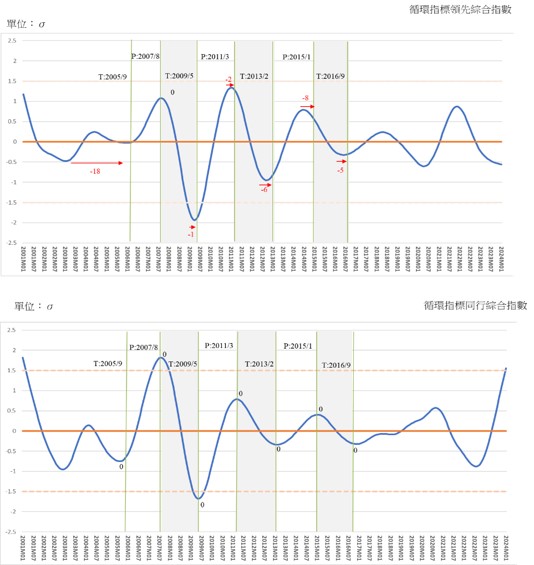
The Leading and Coincidental Composite Indices Curve for this business cycle’s indicator system is shown in Figure 2.
Leading Cyclical Composite Index (LCCIS) has dropped from its peak of 0.8719 Standard Deviations in November 2021 to -0.5591 Standard Deviations in January of the current year (2024). However, the rate of decline has continued to slow down significantly since last year.
The CCCIS has been directly affected by the pandemic, having fallen from its peak of 0.5743 Standard Deviations in September 2020, and turned negative starting in May 2021, reaching its lowest of -0.8791 Standard Deviations in August 2022. It then began to recover and reached a positive value of 0.0442 Standard Deviations in May 2023 and continued to rise to 1.5525 Standard Deviations in January 2024. It is predicted to continue rising to a positive value of 2.5136 Standard Deviations by July 2024. However, the upward trend will weaken by then. Nevertheless, it’s evident that the Commercial Service Industry is poised for a sustainable and robust recovery. (See Figure 1 above and the attached appendix)
Figure 2. Leading and Coincidental Cyclical Composite Index for the Service Industry
Source: Business Cycle Forecasting Team, CDRI
A. Leading indicator series
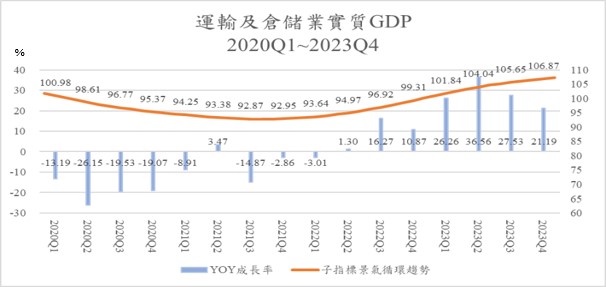
a. Business cycle trend of real GDP of the Transportation and Storage Industry continues to rise, while the upward momentum in H2 2023 is slightly moderate, the recovery remains strong, the cyclical trend values has reach 107.
The cyclical tendency of this sub-indicator reached its lowest point in September 2021, and as of January 2024, it has been increasing for 27 consecutive months. The index surpassed the long-term trend value of 100 in December 2022, and although the momentum has since slowed down, it remains strong. As of January 2024, the index has reached 107.62, ranking as the highest among leading indicators.
However, the annual growth rate (YOY), calculated based on its actual value, has turned from negative to positive in Q2 2022, the fluctuation of the growth rate has increased, reaching 26.26% and 36.56% in Q1 and Q2 last year, respectively. Though it gets back to 27.53% in Q3 and 21.19 in Q4, it still indicates economic vigor.
Figure 3. The annual growth rate of Transportation and Storage GDP and business cycle trend, 2020Q1~2023Q4
Source: Business Cycle Forecasting Team, CDRI and Directorate General of Budget, Accounting and Statistics, Executive Yuan
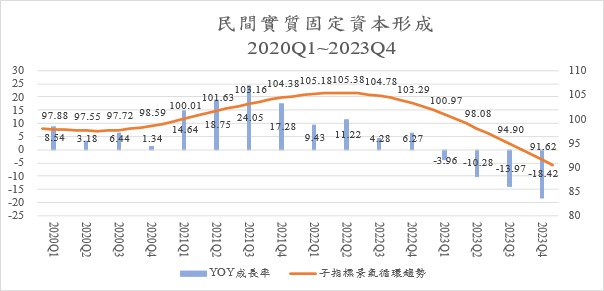
b. The cyclical trend of Private Real Fixed Capital Formation continues to decline, with actual values showing negative growth for three consecutive quarters.
The cyclical tendency of this sub-indicator reached its peak in April 2022, with an index of 105.39, and declined all the way. In April 2023, the index fell below the long-term trend value. In January 2024, it has fallen to 89.42, (it has reached -2.8804 Standard Deviations after being standardized). It’s worth noting that the fervor of Private Investment once driven by the return of Taiwanese businesses is now significantly cooling down.
In addition, the year-on-year growth rate (YoY) based on its actual GDP value has remained positive for each quarter from 2020 to 2022. In Q3 2021, it reached a peak growth rate of 24.05%, but it has been gradually slowing down. In Q1 2023, it turned negative and by Q4, it had declined by 18.42%. This is evidently unfavorable for future productivity and the enhancement of economic growth rates.
Figure 4. Annual growth rate and cyclical trend of Private Real Fixed Capital formation, 2020Q1~2023Q4
Source: Business Cycle Forecasting Team, CDRI and Directorate General of Budget, Accounting and Statistics, Executive Yuan
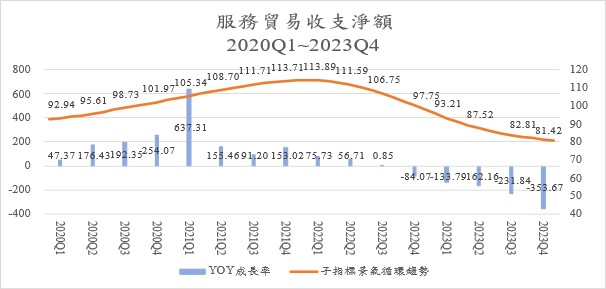
c. The Net Balance of Trade in Services Revenue and Expenditure, which saw a rare surplus during the pandemic, has now reverted to the historical deficit norm. Its cyclical trend has shifted to a sustained decline post-pandemic, with actual values showing negative growth for five consecutive quarters, with the latest quarter (Q4 2023) showing a YOY growth rate of -353.67%.
Looking at its actual GDP value, Taiwan’s service industry, which had enjoyed a rare trade surplus since Q2 2020, has encountered a reversal after 11 quarters. In Q1 2023, it has reemerged as a trade deficit, with the total annual service trade deficit amounting to $9.969 billion USD. This is equivalent to 10.4% of the total Merchandise Trade Surplus of $95.859 billion USD during the same period.
The cyclical tendency of this sub-indicator hit a trough in September 2019 and reached a peak in January 2022, followed by a slight decline, and the decline continues to intensify. As of December 2022, the index was below the long-term trend value and was rapidly declining. As of January 2024, it has continued to accelerate its decline, reaching 80.14 (once being standardized, it’ll drop to a negative 3.4830 Standard Deviations). It’s indicated that Taiwan’s trade in services has historically been in deficit, but the disruption of international travel due to the pandemic in 2020 led to a significant improvement in Taiwan’s Net Balance of Trade in services, which became a rare surplus starting from Q2 2020. However, now that the pandemic is finally over and countries are gradually lifting restrictions, international travel is resuming, and Taiwan’s Service Industry trade deficit, driven by long-term structural factors, is once again becoming evident.
Looking at its actual GDP value of the Net Service Trade, it experienced a negative growth of -84.07% in Q4 2022, and -133.79% in Q1 2023, -162.16% in Q2, -231.84% in Q3 and -353.67% in Q4. This clearly indicates an expanding trade deficit.
Figure 5. Annual growth rate and cyclical trend of net trade in Services Revenue and Expenditure, 2020Q1~2023Q4
Source: Business Cycle Forecasting Team, CDRI and Directorate General of Budget, Accounting and Statistics, Executive Yuan
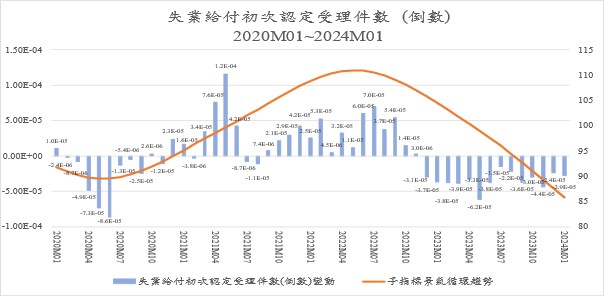
d. Initial Acceptance of Unemployment Benefits (inverted) indicates that the economy is not doing well. While there is a severe labor shortage in the Accommodation and Catering Industry, the overall pressure on labor demand has eased.
The cyclical tendency of this sub-indicator reached its lowest value of 89.45 in May 2020, and then rose all the way, and had exceeded the long-term trend level of 100 in June 2021. It reached 110.9 at its peak in May 2022, indicating a rapid recovery in employment demand. However, it subsequently reversed and started declining. As of May 2023, the inverted Initial Acceptance of Unemployment Benefits had lower than the long-term trend value (100), and dropped to 85.73 as of January 2024, indicating a slowdown in employment demand. However, it’s worth noting that the Manufacturing and Service Industries are exhibiting an opposite trend of uneven economic situation (both domestically and externally), showing that this indicator, which reflects the overall labor market situation, may not fully represent the conditions in the Commercial Service Industry, particularly in the recovering Accommodation and Catering Industry, which is booming, and the labor shortage situation is still difficult to see immediate relief.
Figure 6. Number of the initial acceptance of unemployment benefits (inverted) and the annual growth rate and cyclical trend January 2020 to January 2024
Source: Business Cycle Forecasting Team, CDRI and Directorate General of Budget, Accounting and Statistics, Executive Yuan
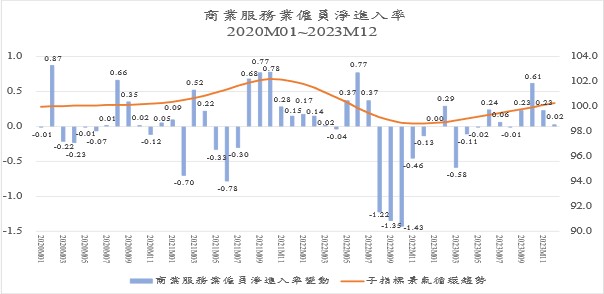
e. Net Entry Rate of Employees in the Commercial Services Industry has reached its lowest point in December last year, and now, there is a mild expansion in employment demand in the Service Industry.
The cyclical tendency of this sub-indicator reached its peak of 102.19 in October 2021, then began to decline, falling below the long-term trend value of 100 from June 2022, hitting its lowest point in December with a cyclical index of 98.6. In 2023, after the trend reversed from declining to rising, it experienced a gradual increase, reaching a cyclical trend value of 100.45 as of January 2024. This indicates a mild expansion in employment within the Commercial Services sector.
Figure 7. Annual changes and cyclical trends in the net entry rate of Employees in the Commercial Service Industry, January 2020 to December 2023
Source: Business Cycle Forecasting Team, CDRI and Directorate General of Budget, Accounting and Statistics, Executive Yuan
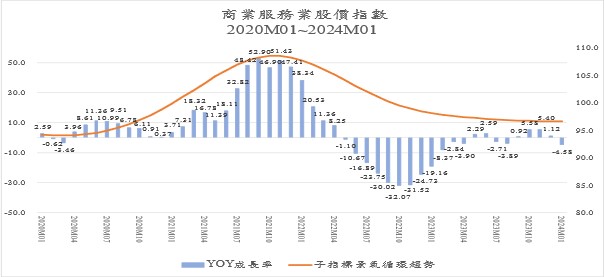
f. The declining trend of the Commercial Services sector’s Stock Price Index is currently decelerating., indicating that the decline in economic fluctuations is approaching its end.
The cyclical tendency of this sub-indicator has reached its peak October 2021, with an index of 108.52. This reflected the prosperous trend of the general stock market in Taiwan for the past year and a half. However, due to the lack of follow-up, it started to decline after reaching the peak, and has continued to decline for 27 months. As of January 2024, it has dropped to 96.57. Nevertheless, the declining trend has been consistently slowing down since the end of 2022, with the rate of decrease accelerating, decreasing from a maximum of -1.03 in May 2022 to -0.04 in January 2024.
An indicator is the annual growth rate of the actual Stock Price Index. It turned negative in May 2022, and the decline continued to expand, with a drop of over 30% in September. In December and January 2023, the decline remained in double digits at -24.73% and -19.16%, respectively. Subsequently, the negative growth rates turned to single digits. The index has been fluctuating within single-digit ranges since May 2023 until January 2024, indicating that its trend is still experiencing relatively mild downward fluctuations. However, the decline is noticeably slowing down, and there is hope for a prompt return to stable recovery.
Figure 8. The annual growth rate and circular trend of the Stock Price Index of the commercial service industry, January 2020 to January 2024
Source: Business Cycle Forecasting Team, CDRI and Directorate General of Budget, Accounting and Statistics, Executive Yuan
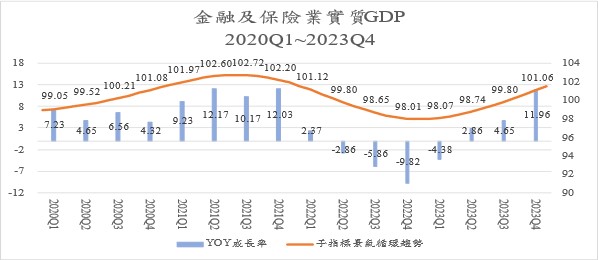
g. The real GDP growth rate in the Finance and Insurance Sector had four consecutive quarters of negative growth and keep rising in Q3 2023. The cyclical trend, which experienced a continuous decline for one year, is currently on the rise.
The cyclical tendency of this sub-indicator reached its peak at 102.74 in July 2021, and then turned downward, returning to the long-term trend value (100) in May 2022, and has dropped to its trough 97.95 in December. After reversing and starting to rise, it has increased to 101.93 by January 2024, with the upward speed gradually accelerating, indicating that the economy has not experienced a rapid recovery but has returned to the edge of the long-term trend.
Also, looking at the annual growth rate (YOY), it turned negative starting in Q2 last year, with a growth rate of -2.86%. In Q3, it further decreased to -5.86%, followed by -9.82% in Q4, and -4.38% in Q1 2023, 2.86 in Q2, 4.65% in Q3, and a further acceleration to 11.96% in Q4. This confirms that after a year of continuous decline in the economic trend, there is now a slight hope of recovery.
Figure 9. Annual growth rate and cyclical trend of real GDP of Finance and Insurance Sector, 2020Q1~2023Q4
Source: Business Cycle Forecasting Team, CDRI and Directorate General of Budget, Accounting and Statistics, Executive Yuan
B. Coincident indicator series
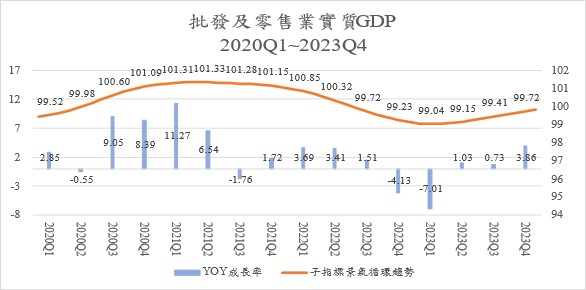
a. The real GDP cyclical trend and actual values of the “Real GDP Index of Wholesale and Retail” have both been steadily rising for three consecutive quarters, indicating that the economy is gradually recovering and stabilizing.
The cyclical tendency of this sub-indicator reached its peak of 101.33 in April 2021. It has been declining since then and fell below the long-term trend value of 100 in July 2022, reaching a trough in February 2023 with a cyclical trend value of 99.04. After a slight increase for three consecutive quarters, it reached 99.94 in January 2024, indicating that the economy is clearly showing a gradual recovery.
Meanwhile, looking at the actual values annual growth rate. After declining by 4.13% in Q4 2022 and 7.01% in Q1 2023, there were subsequent increases of 1.03%, 0.73%, and 3.86% in Q2 to Q4, respectively. This indicates that the industry is gradually experiencing an economic recovery.
Figure 10. Annual growth rate and cyclical trend of real GDP Index of Wholesale and Retail, 2020Q1~2023Q4
Source: Business Cycle Forecasting Team, CDRI and Directorate General of Budget, Accounting and Statistics, Executive Yuan
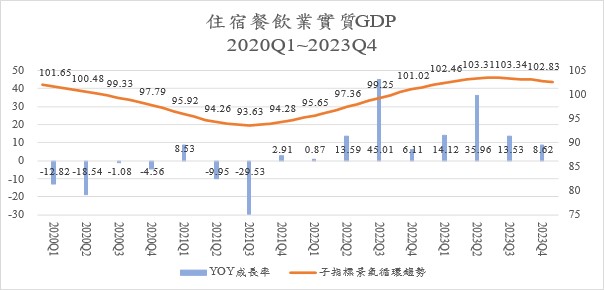
b. “Real GDP of the Accommodation and Catering Industry” hit the bottom in August 2021, followed by a continuous and accelerated recovery. Although it peaked in July 2023, the cyclical trend has been declining for two consecutive quarters, indicating a slight slowdown in economic momentum. However, this has not yet impacted the overall economic outlook positively.
The cyclical tendency of this sub-indicator hit the bottom in August 2021, leading the economic recovery. The cyclical index steadily rose from the trough of 93.63, surpassing the long-term trend value of 100 by October 2022. In July 2023, the cyclical index reached its peak at 103.41, followed by a gradual decline. As of January 2024, the cyclical trend value is 102.41, still above the long-term trend value of 100, and the economic prosperity remains intact.
The actual annual growth was severely impacted by the pandemic, reaching its lowest point at -29.53% in Q3 2021. It then started to rebound, but the growth rates in each quarter have been fluctuating. In Q3 2022 and Q2 2023, there were exceptionally high growth rates of 45.01% and 35.96%, respectively. In Q3, there’s still a 13.62% growth rate, and 8.62% in Q4, indicating that the economic cycle is stabilizing and recovering steadily.
Figure 11. The annual growth rate and circular trend of real GDP in the Accommodation and Catering Industry, 2020Q1~2023Q4
Source: Business Cycle Forecasting Team, CDRI and Directorate General of Budget, Accounting and Statistics, Executive Yuan
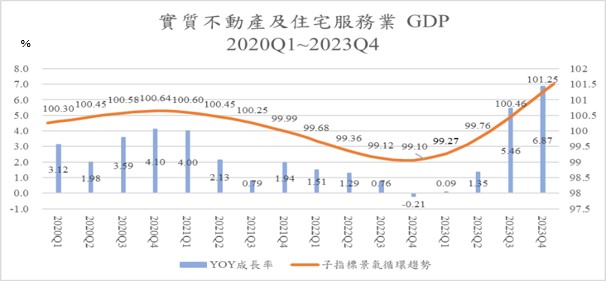
c. Real GDP of Real Estate and Residential Service Industry business cycle trend is on the rise from its trough. While there hasn’t been significant long-term cyclical fluctuation, it has returned above the long-term trend, with four consecutive quarters of growth, indicating a stable economic recovery.
The cyclical tendency of this sub-indicator fluctuates slightly over the long-term. The index peaked in November 2020, with a value of 100.64. From there, it gradually declined, and it fell below the long-term trend of 100 by November 2021 and accelerating downward. The downward trend gradually intensified but reached its lowest point in October 2022 with an index of 99.06. Subsequently, the upward momentum accelerated, reaching 101.78 by January 2024.
The actual annual growth rate reached -0.21% in Q4 2022 and continue to rise, with growth rates increasing each quarter: 0.09% in Q1 2023, 1.35% in Q2, 5.46% in Q3, and 6.87% in Q4. This indicates a stable economic recovery.
Figure 12. Annual GDP growth rate and cyclical tendency of Real Estate and Residential Service Industry, 2020Q1~2023Q4
Source: Business Cycle Forecasting Team, CDRI and Directorate General of Budget, Accounting and Statistics, Executive Yuan
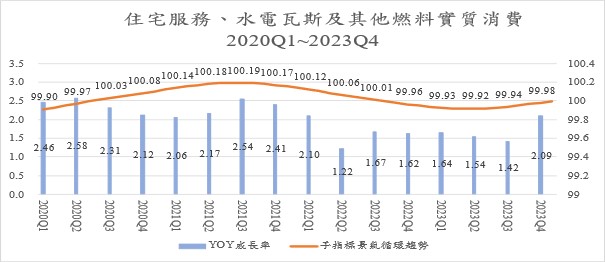
d. Real consumption of “Residential Services, Utilities, and Other Fuel Industries” has experienced relatively minor long-term fluctuations. However, after a slight decline in the economic cyclical trend over 21 months, there has been an upward trend for the past eight months, indicating a genuine improvement in economic conditions.
The cyclical tendency of this sub-indicator showed little long-term fluctuation. It peaked in August 2021, reaching a cyclical trend value of 100.19. Subsequently, it gradually declined, hitting a trough in May 2023 at 99.91. As of January 2024, it has risen to 100.01.
Looking at the annual growth rate, growth has been observed in every quarter since 2020, but the magnitude of the fluctuations has been small. The annual growth rate has fluctuated between a high of 2.58% (in Q2 2020) and a low of 1.22% (in Q2 2022). In Q3 2021, there was a growth of 2.54%, reaching its peak. Subsequently, it fluctuated downward, hitting the lowest point in Q2 2022, with a growth of 1.22%. It then surged to 1.67% in Q3, followed by a gradual reduction in quarterly fluctuations. In Q4 2023, the growth rate has leaped to 2.09%, indicating that while the actual year-on-year growth remains positive, there hasn’t been significant long-term economic fluctuation, and the current cyclical trend has recovered since H2 2023.
Figure 13. Real Consumption of Residential Services, Utilities, and Other Fuel Industries, 2020Q1~2023Q4
Source: Business Cycle Forecasting Team, CDRI and Directorate General of Budget, Accounting and Statistics, Executive Yuan
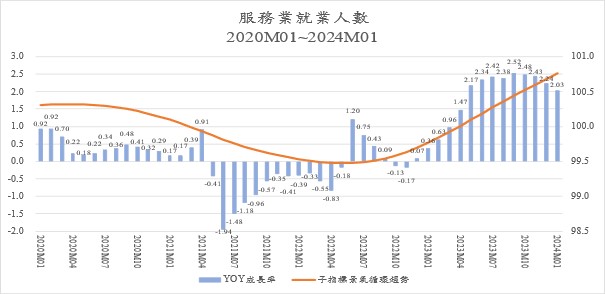
e. The cyclical trend of Number of employees in the Service Industry has shown a continuous upward trend in the business cycle, surpassing the long-term trend value since March 2023. This indicates an increase in labor demand. Consequently, the pressure of labor shortages has been on the rise, with no sign of easing.
The business cycle trend of this indicator hit a trough in May 2022, with an index of 99.47. After the decline, it gradually started to rise, and by April 2023, the trend value exceeded the long-term trend of 100. Furthermore, the momentum has continued to strengthen, with the cyclical index reaching 100.76 in January 2024 (once standardized, it’ll reach a positive 3.7428 Standard Deviations). It indicates an unprecedented prosperity in employment within the Commercial Service Industry, which complements the vibrancy in the Accommodation and Catering Industry. However, this mutual prosperity also comes with significant labor shortage pressures.
Looking at the annual growth rate, it has been consistently positive since December 2022, and the growth rate has been steadily increasing. Starting at 0.07% in December 2022, it has risen to 2.52% in September and 2.48% in October this year (2023). This reflects an increase in labor demand, which, in turn, has heightened the pressure on employers due to labor shortages.
Figure 14. The growth rate and cyclical tendency of The Number of Employees in the Service Industry, January 2020 to January 2024
Source: Business Cycle Forecasting Team, CDRI and Directorate General of Budget, Accounting and Statistics, Executive Yuan
C. Lagged indicator series
The lagged indicator includes Real Consumption of Tobacco and Alcohol, Real Consumption of Clothing, Footwear, and Apparel, Real Consumption of Furniture, Equipment, and Housekeeping, and the Number of Initial Recognition and Acceptance of Unemployment Benefits. The Lagged Index can be used as a reference for observing whether a business cycle is over. This article omits relevant analysis.
Appendix
Business Cycle Coincident Composite Index for Taiwan Service Sector
|
Year/Month
|
Deviation of Standardized Cyclical Coincident Composite Index
(Unit: σ, Benchmark: 0)
|
Remark
|
|
2024-07
|
2.5136
|
(P)
|
Use ARMA Model: (4,0)(0,0) to make predictions based on the leading effect set for half year
|
|
2024-06
|
2.3913
|
(P)
|
|
2024-05
|
2.2476
|
(P)
|
|
2024-04
|
2.0875
|
(P)
|
|
2024-03
|
1.9157
|
(P)
|
|
2024-02
|
1.7363
|
(P)
|
|
2024-01
|
1.5525
|
(f)
|
The estimated value of the Coincident Composite Index
|
|
2023-12
|
1.3666
|
(a)
|
The actual value of the Coincident Composite Index
|
|
2023-11
|
1.1796
|
(a)
|
|
2023-10
|
0.9917
|
(a)
|
|
Source: Business Cycle Forecasting Team, CDRI
Note:
1. (a): actual; (f): estimated; (p): predicted.
2. The most recent reference cycle turning point: September 2016 (trough).
3. Leading indicator sub-indicators: (1) Real GDP of the Transportation and Storage Industry*, (2) Private Real Fixed Capital Formation*, (3) Net Balance of Trade in Services Revenue and Expenditure*, (4) Initial Acceptance of Unemployment Benefits (inverted), (5) Net Entry Rate of Employees in the Commercial Services Industry, (6) Stock Price Index of the Commercial Service Industry, (7) Real GDP of Finance and Insurance*.
4. Coincident indicator sub-indicators: (1) Real GDP of Wholesale and Retail Industry*, (2) Real GDP of Accommodation and Catering Industry*, (3) Real GDP of Real Estate and Residential Industry*, (4) Real Consumption of Residential Services, Utilities, and Other Fuel Industries*, (5) Number of Employees in the Service Industry.
5. Lagging indicator sub-indicators: (1) Real Consumption of Tobacco and Alcohol*, (2) Real Consumption of Clothing, Footwear, and Accessories*, (3) Real Consumption of Furniture, Equipment, and Household Maintenance*, (4) Initial Acceptance of Unemployment Benefits.
* Indicates that these indicators are calculated based on quarterly data and may require extrapolation due to data limitations.
|