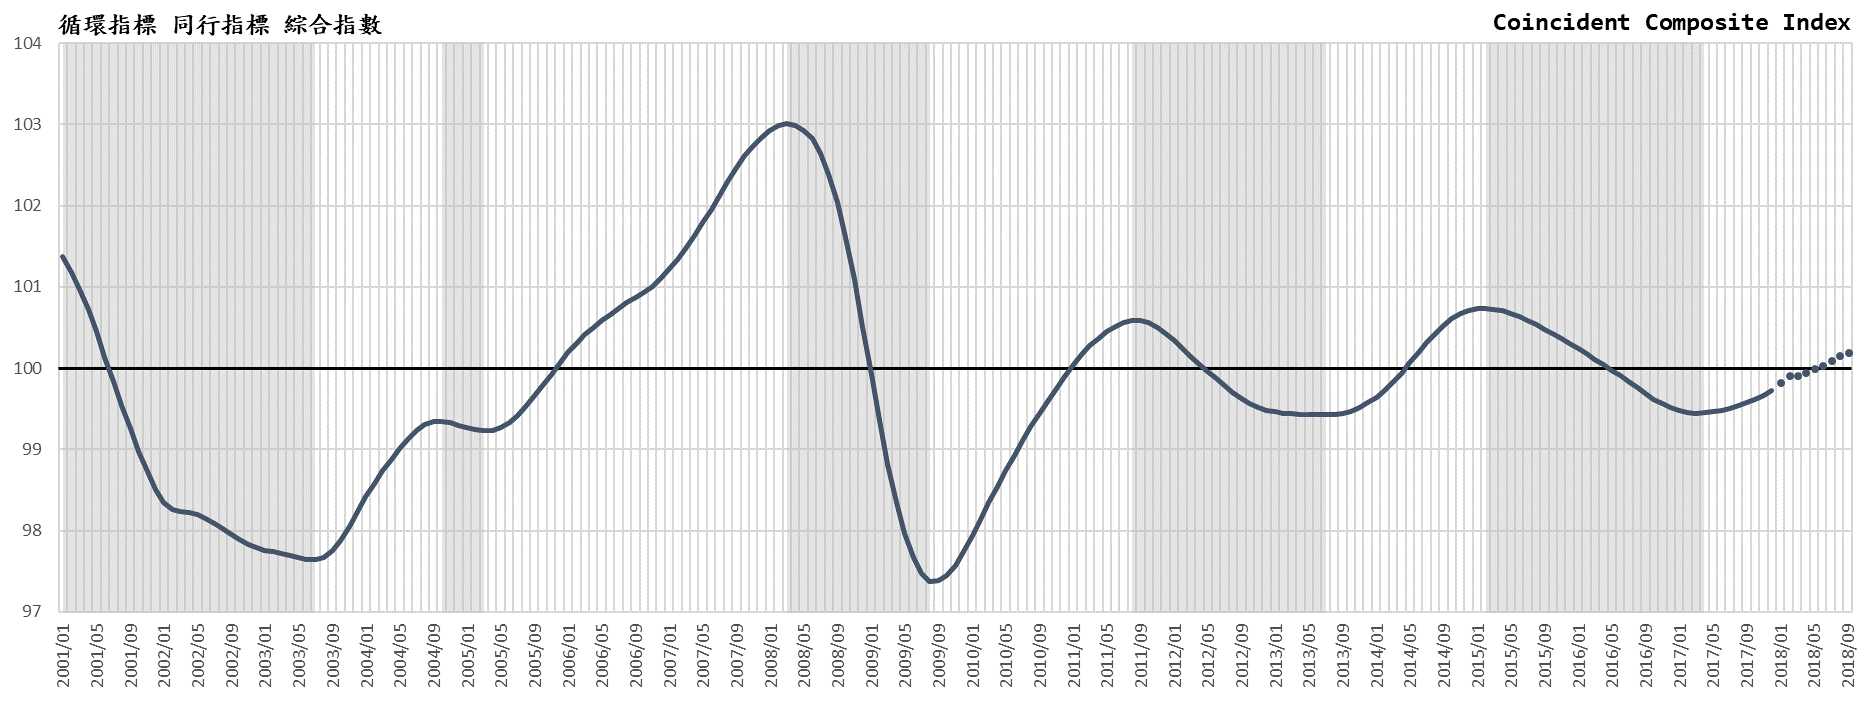
The Business Cycle Forecast Team of the CDRI analysed the "Coincident Indicator Composite Index", since the bottom from April 2017 (99.45) and then reached 99.73 at the end of the year, and is expected to reach to the normal point of 100 on May. However, the pace of recovery is still sluggish, expected to reach 100.2 in September, this is the weakest recovery compares to the past.
The reason for the index stagnation lies in both that the “private fixed capital formation” in the leading indicators (the actual statistics for Q1 have not yet been released, was extrapolated from the data of Q4 last year) and “employment net entry rate in the business services sector”(Extrapolated from the data in February) go down in March 2018.
Investment and employment have become sluggish and there is a hidden concern in the improvement of productivity. In March, the actual value of the "Commercial Services Industry Stock Price Index" and "Number of Unemployment Benefits Initial Accepted cases" (reciprocal) rose and the "actual GDP of transport and warehousing" and "net of service trade" (extrapolated from Q4 last year) keep improve in March, which means the recovery is continuing but remains weak.
Are the brain drains in high-tech service industries and high-level management personnel a pressure relief for unemployment rate, but has made the significance of unemployment indicators representing the changes in the service industry in the past smaller? This is also an issue worth our further study.
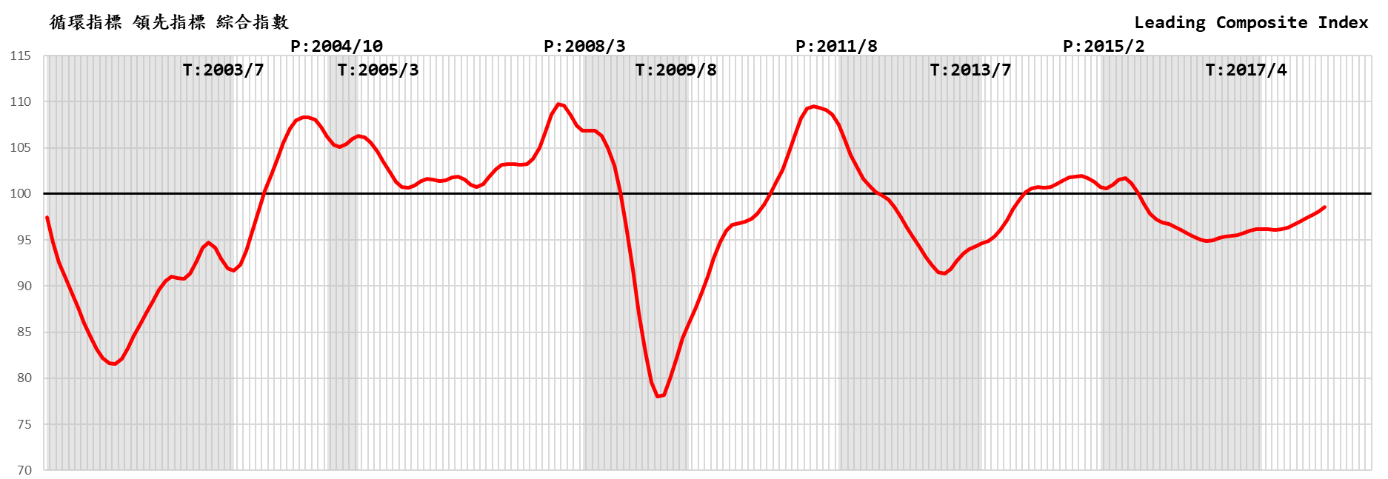
Monthly Cyclical Index are shown in the table below, sub-indices as six Leading Indicators with time sequence, five Coincident Indicators and four Lagging Indicators with time sequence are also provided. The graphic below shows the Leading Composite Index and the Coincident Composite Index from January 2001 till present.
The “Cycle Index” (the percentage of the cyclic value in the time sequence analysis to the long-term trend value) shows the fluctuation of the cycle. As shown in the following graphics, comparing to the previous recovery processes, we find that the financial crisis in 2008 drastically dropped the Coincident Indicator Cycle Index to 97.38 in August 2009, followed by a rapid climb, returning to a normal level of 100 after 17 months. The average monthly increase of 0.157 is a typical V-shape recovery. In the March 2005 (99.23) and June 2013 (99.43), the number rose from the bottom. The average monthly rate of increase to 100 was 0.074 and 0.046. This time, the bottom was 99.45 in April 2017, which was a slight recession, but the recovery speed was extremely slow. The forecasted index did not reach 100 until May of this year. After 13 months, the average monthly increase was only 0.042. It is estimated that the index will reach to only 100.20 in September this year, after 17 months. The average of monthly increase is only 0.0441. Although the index predicts a slight acceleration over the last four months after reaching the long-term trend, the strength remains less than Q1 this year. The current trend of recovery so far has been the weakest and the slowest comparing to the previous cycles. This is a “low-level equilibrium” phenomenon after the financial crisis, due to the overall economic structure has not yet fully recovered.
Our service industry in Taiwan was hit by the global financial crisis in 2008 and was far less resilient than the manufacturing industry. The digital technology changes in such as new retail, mobile payment, IoT, AI, and robotics are emerging in the service industry revolution in the advanced economies recent years, which have been accelerating the “digital transformation” in response to the new mediocre VUCA (volatility, uncertainty, complexity, ambiguity) environment. Increasingly fierce competition in the world. The new signs of sluggish business cyclical movement in the service sector n is severe and should not be underestimated (system design guidance and business analysis: Tain-Tsair Hsu, Chairman of CDRI).
Business Cycle Composite Index for Taiwan Service Sector
Source: Business Cycle Forecasting Team of CDRI