Commerce Development Research Institute released the Business Cycle Coincident Composite Index for Taiwan Service Industry today (5th December). It is predicted that the economic slowdown will continue until April next year. The economic outlooks among industries will stay divergent, and the aggregated demand will hardly rebound and persist in declining at a slower pace.
Below are the two key points from the observation:
1. This business cycle indicator system has long predicted the return of Taiwanese businesspeople. In contrast to the past, Taiwan has put foreign investment over domestic investment, which caused sluggish domestic demand that weakened economic growth. Right after the Q3 GDP statistics of the Directorate-General of Budget, Accounting and Statistics, Executive Yuan has been released, the system has confirmed that the “Private Real Fixed Capital Formation”, one of the leading indicators, has continued to rise. The "Real GDP of Finance and Insurance Sector" has changed from a negative trend to a positive direction beginning in May of this year (2019).
2. The verification of that Taiwan has a long history of cyclical changes in the overall economic prosperity prior to the service sector. This is the uniqueness of Taiwan's industrial structure. Based on the time series analysis of the overall GDP and the GDP of the service industry, it is found that the former circular trend has stopped falling and started to rise in June this year (2019). As long as the upward forces continue to accumulate, it will soon be seen that the index of the service industry has begun to rise. (See Chart 2 below.) According to the current economic cycle indicator compiled by the National Development Council, its leading and coincident composite indexes have risen by 10 months and 6 months respectively. Both of the leading and coincident business service composite cycle indexes of this indicator system continue to fall, though continues to slow down and might stop to rise in the near future. The good news is likely to appear in Q2 of 2020.
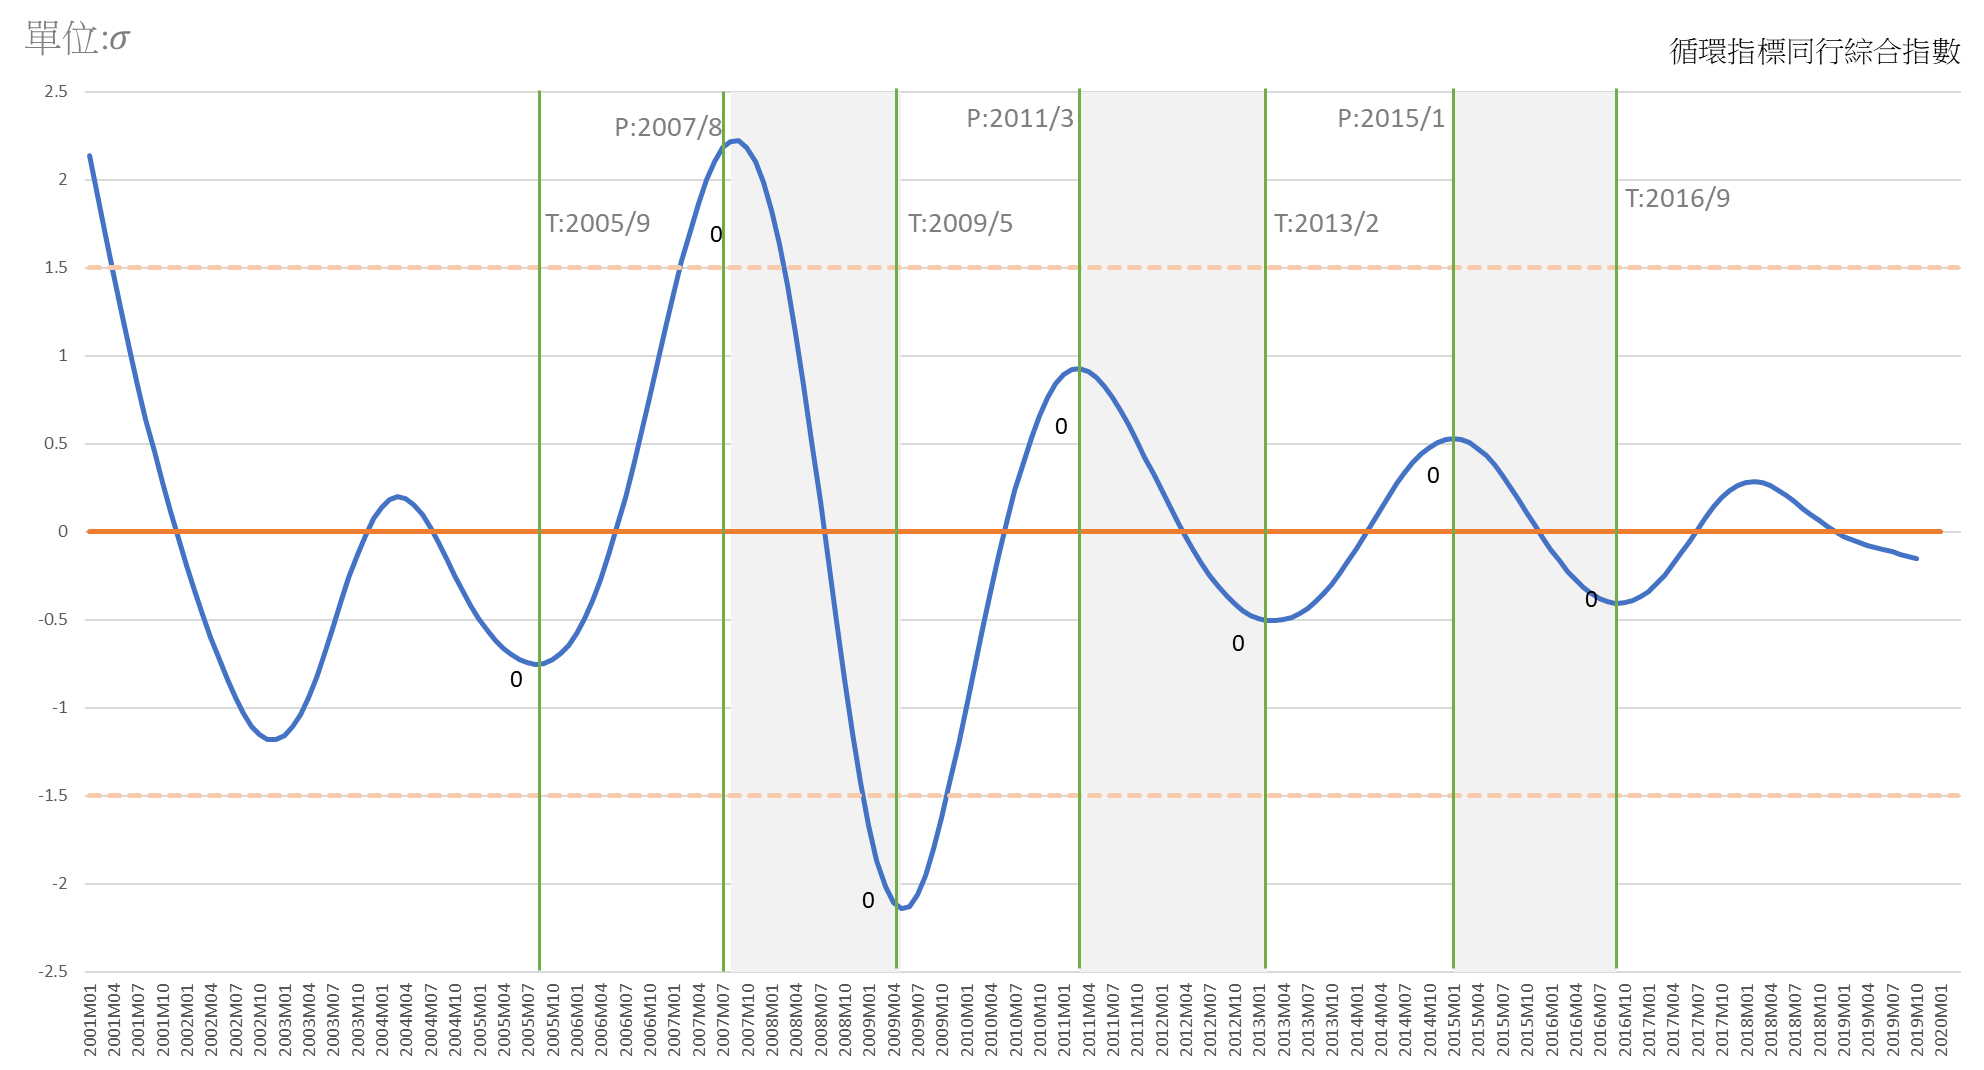
The Fluctuations and Forecasts of Cycle Coincident Composite Index
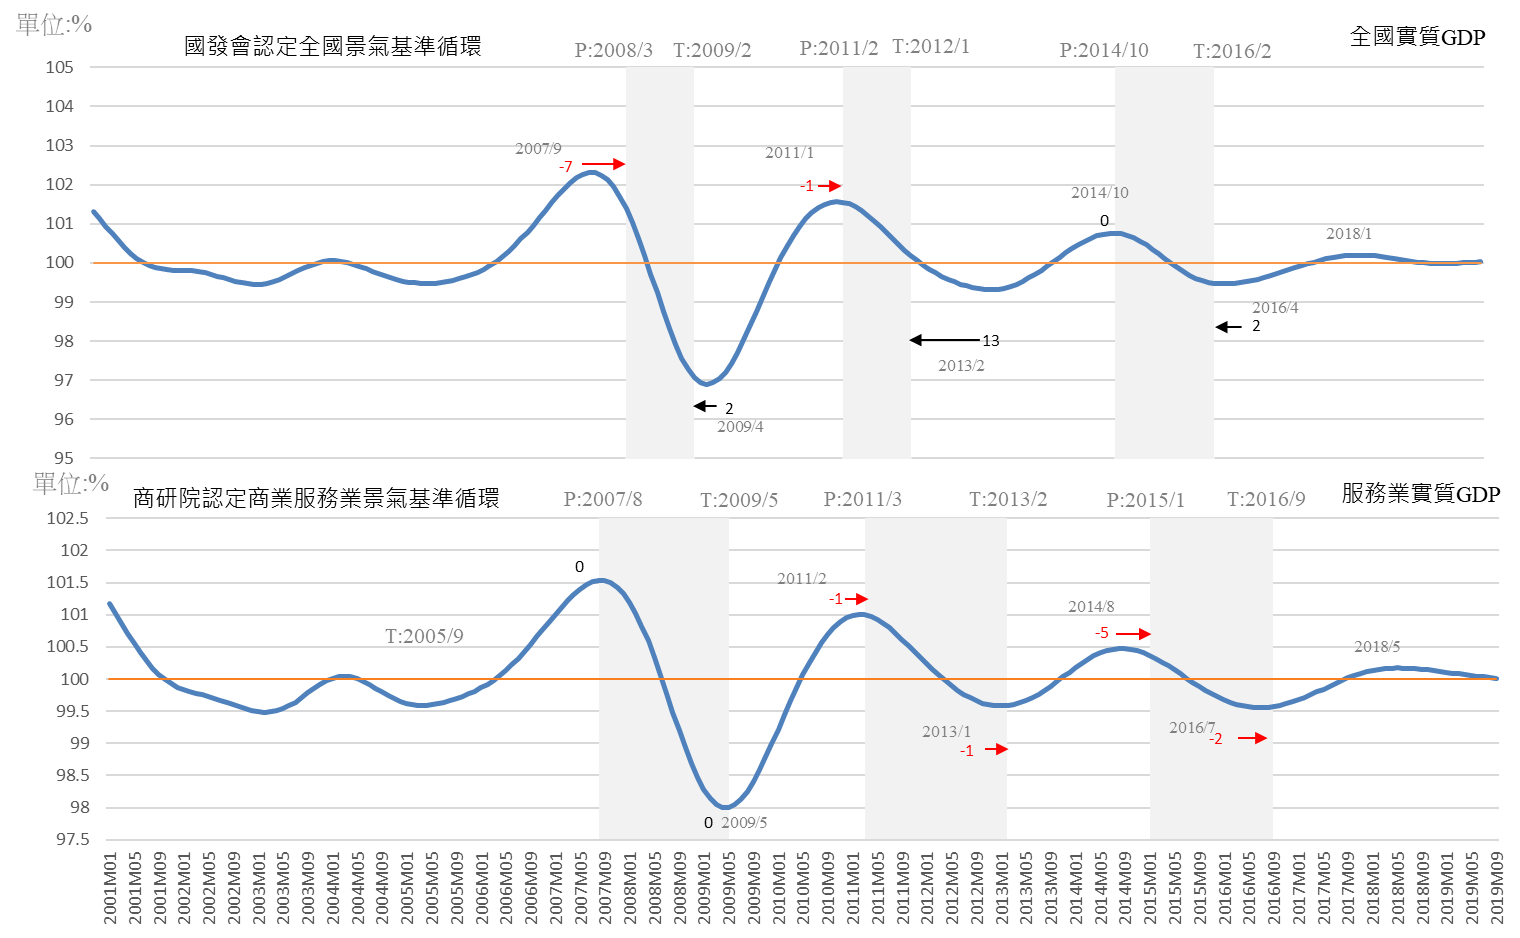
Cycle Trend Comparison of the National Real GDP and the Real GDP of Service Sector
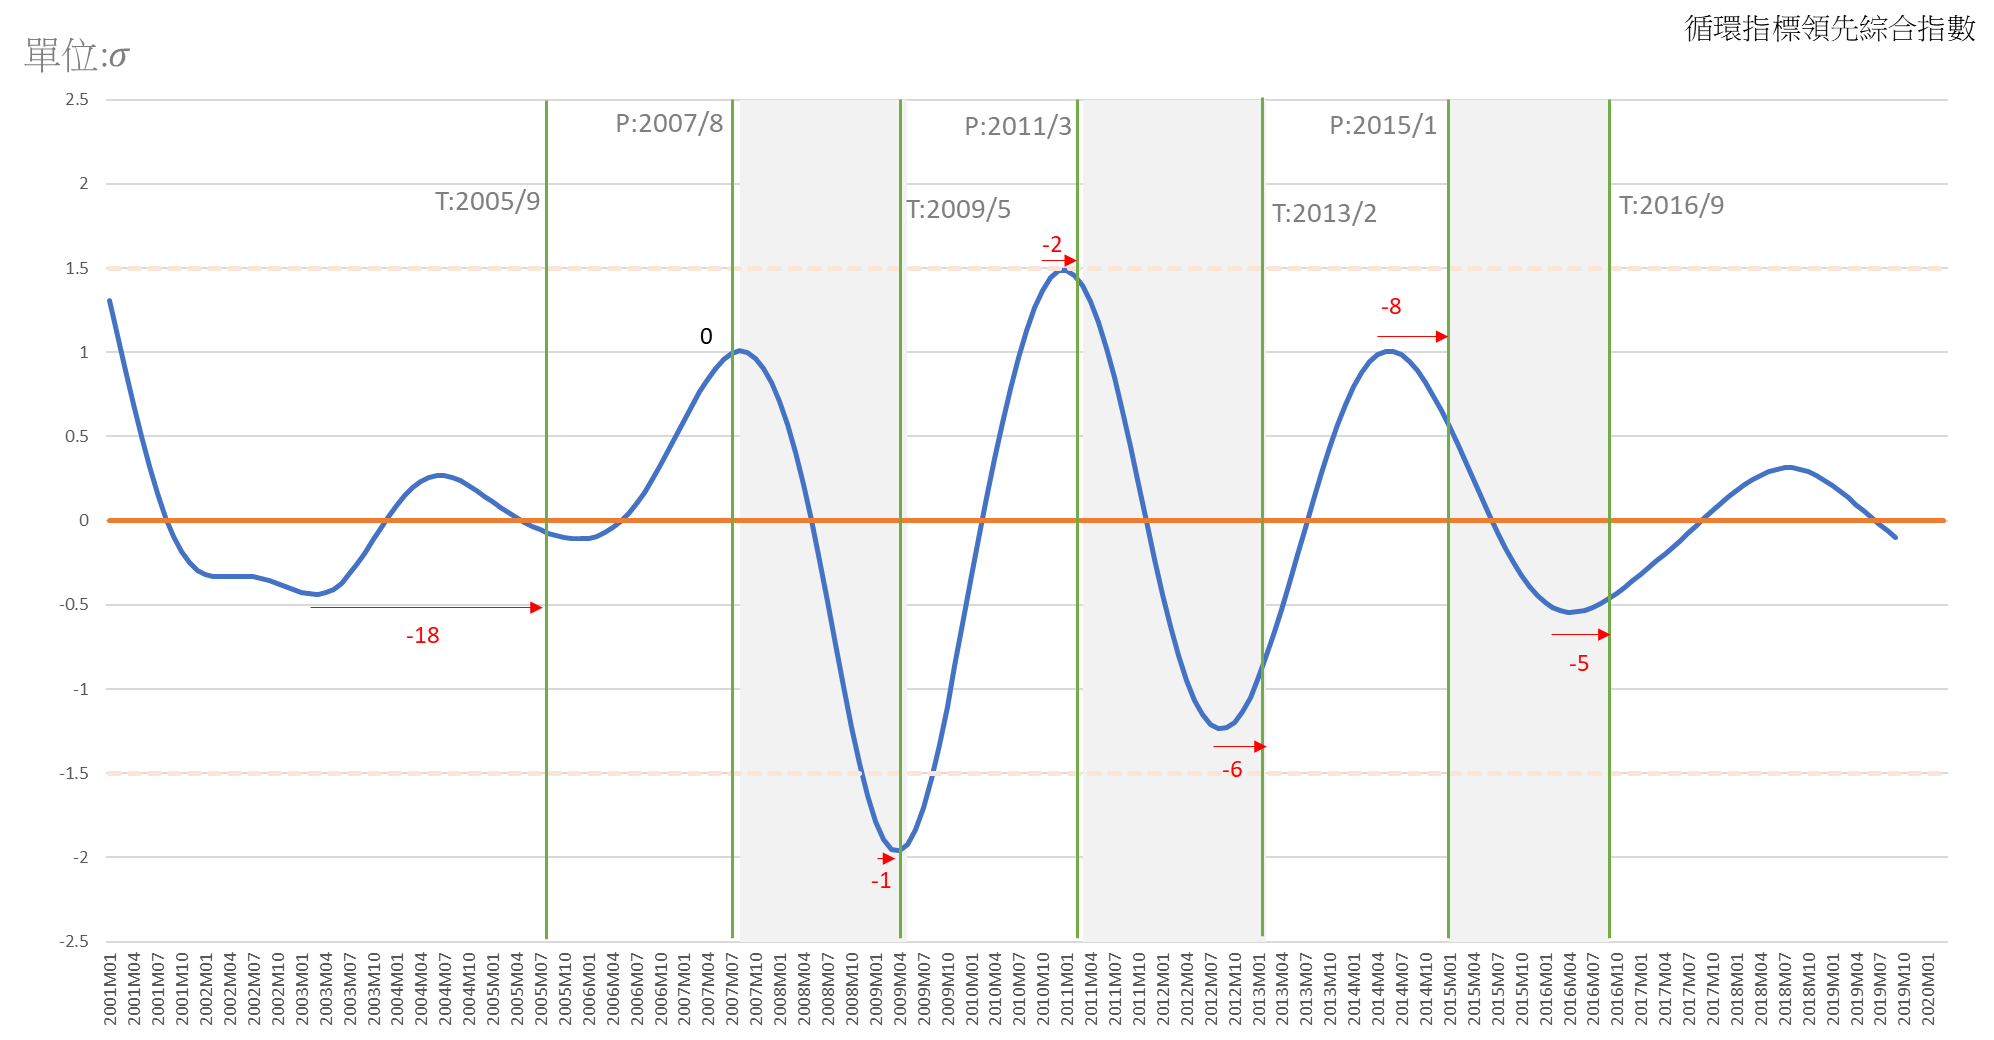
A. The peak of real value of Cyclical Leading Composite Index for Service Industries appeared in August 2018, then slide down all the way till October 2019, a small change is that in July this year, the comprehensive index of the business cycle trend began to fall below the long-term trend value, but the declination is slowing down. The reason is that since “Private Real Fixed Capital Formation" began to stop falling and rose in March 2018, the business cycle index has continued to exceed the long-term trend value (100) in January 2019, and reached 102.55 in October. The long-term deficit of trade in the service sector has also been shrinking since January 2017. The cycle trend value began to exceed the long-term trend (100) in August 2018 and reached 100.94 in October this year. Although other sub-indicators, including Transportation and Warehousing Sector, Employment and the Stock Market, continue to decline, and their cyclic trend values continue to be lower than the long-term trend, the result is that the decline rate of the overall service industry's business cycle leading composite index has slowed significantly.
B. The overall business services industry continued to decline slower and slower. When the Directorate-General of Budget, Accounting and Statistics, Executive Yuan released Q3 GDP this year, some adjustments had been made, caused changes in the current trends of the sub-indicators of the coincident indicators.
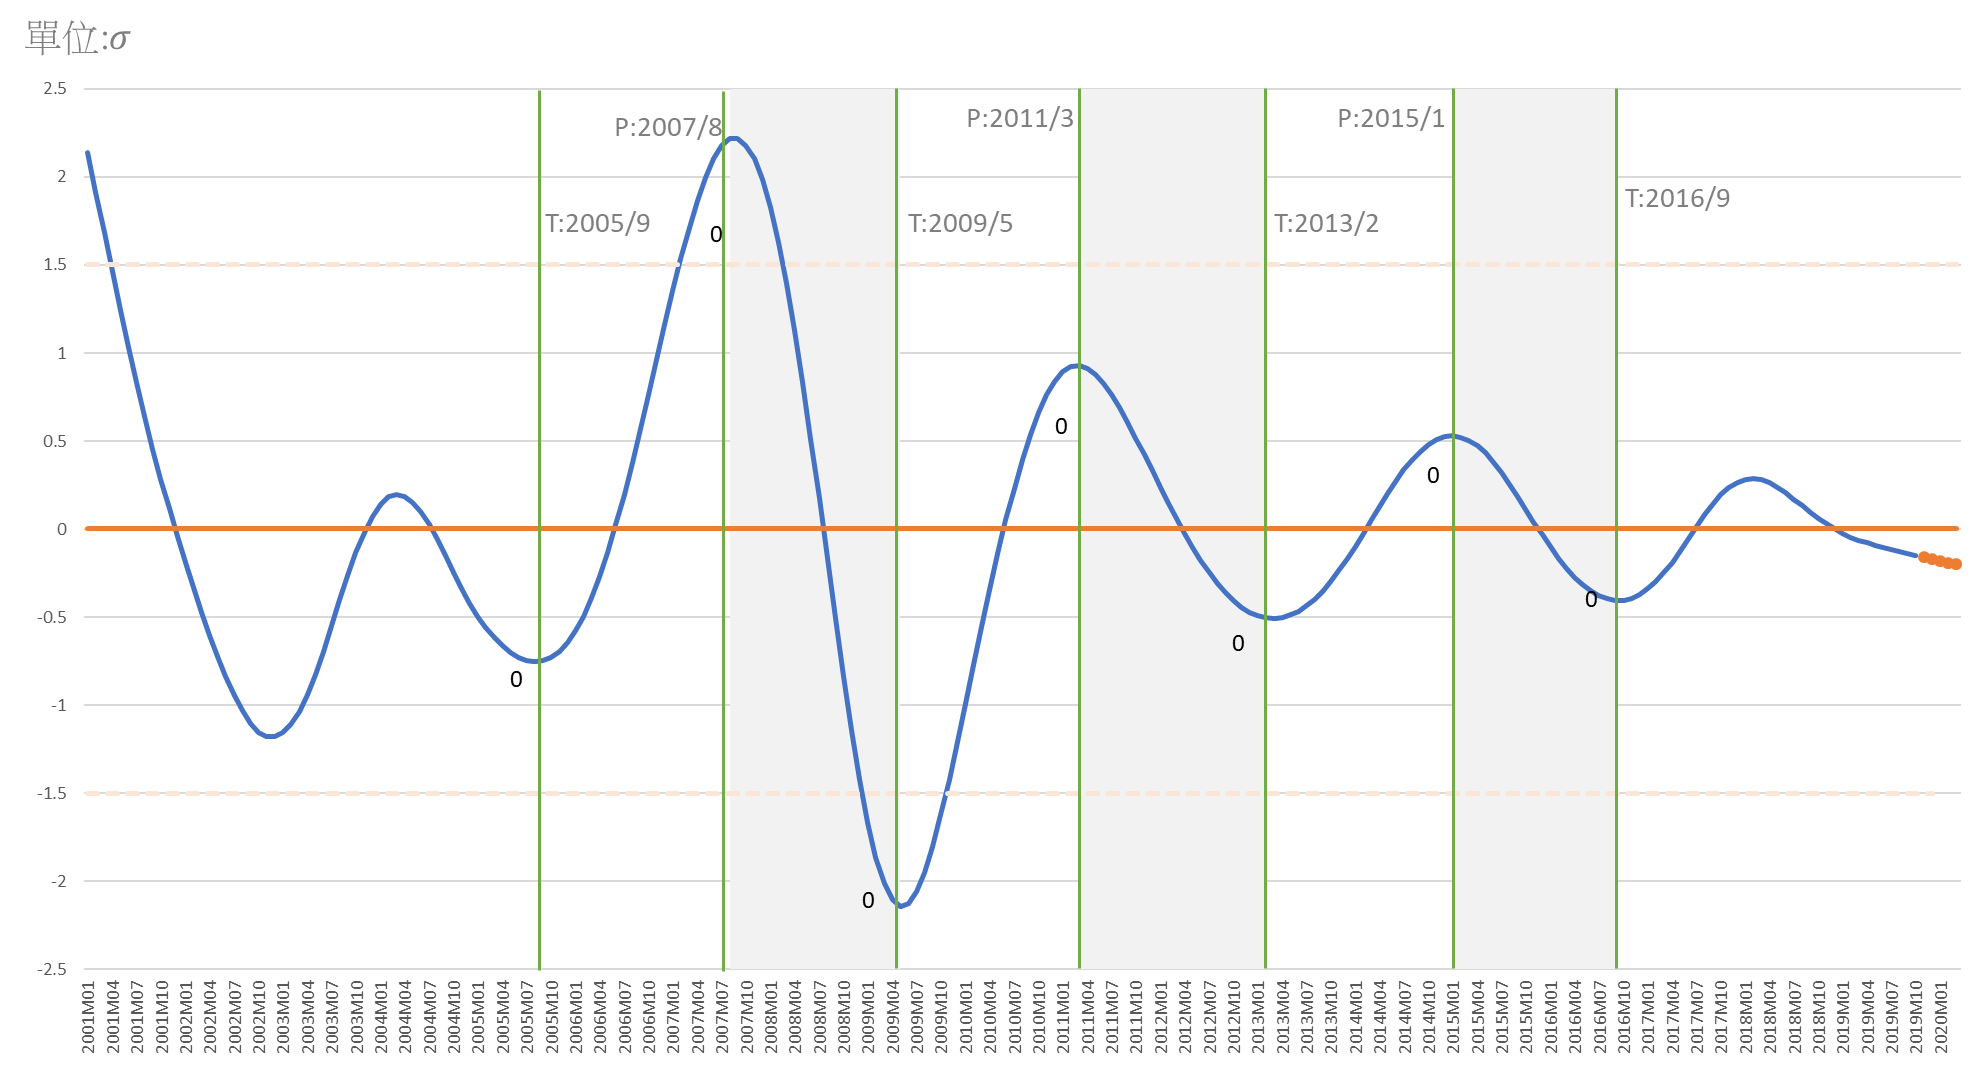
The comprehensive index of the business cycle coincident index has turned downward and continued to decline in March 2018. Its decline has accelerated in the second half of the year, peaking in the first half of this year (2019), and it has slowed down significantly in Q3. Also, the result of the actual value in Q2 this year is better than estimated, it is predicted that the rate of decline in April (2020) will be less than 40% in Q3 this year.
The change in the standardized composite index is shown in unit deviation standard deviation, from the peak positive 0.28 standard deviation (σ) in February last year to the negative 0.02 standard deviation (σ) in January this year, and negative 0.14 standard deviation is predicted in September this year (2019), then continue to fall to a negative 0.2 standard deviation in April next year (2020). It shows that the slowdown exists yet moderating significantly. To strive for the early recovery, measures should be strengthened. In a world of digital economy, it is recognized that the investment and business model application of new technology is the main driving force for economic growth. Fiscal expenditure or financial policies must be complied with the digital transformation to take effect.
Business Cycle Coincident Composite Index for Taiwan Service Sector
|
Year/Month
|
Deviation of Standardized Cycle Indicators
(Unit: σ, Benchmark: 0)
|
Remark
|
|
2020-04
|
-0.2023
|
(P)
|
Prediction based on the lead effect for six months of the ARMA Model:(4,0) (0,0)
|
|
2020-03
|
-0.1978
|
(P)
|
|
2020-02
|
-0.1910
|
(P)
|
|
2020-01
|
-0.1823
|
(P)
|
|
2019-12
|
-0.1724
|
(P)
|
|
2019-11
|
-0.1615
|
(P)
|
|
2019-10
|
-0.1501
|
(f)
|
The estimated value of the coincident composite index
|
|
2019-09
|
-0.1385
|
(a)
|
The actual value of the coincident composite index
|
|
2019-08
|
-0.1268
|
(a)
|
|
2019-07
|
-0.1152
|
(a)
|
|
Source:Business Cycle Forecasting Team, CDRI
|
|
Note:
|
|
a
|
(actual)
|
|
|
|
f
|
(estimated)
|
|
|
|
p
|
(predicted)
|
Business Cycle Composite Index for Taiwan Service Sector
Source: Business Cycle Forecasting Team, CDRI
|
Cycle
|
Trough
|
Peak
|
Trough
|
|
1
|
2005/9
|
2007/8
|
2009/5
|
|
2
|
2009/5
|
2011/3
|
2013/2
|
|
3
|
2013/2
|
2015/1
|
2016/9
|
Table: The Reference Cycle of Taiwan’s Service Industry
(Business Cycle Indicator System is designed, instructed and analyzed by Professor Tain-Tsair Hsu)