Commerce Development Research Institute released the Business Cycle Coincident Composite Index for Taiwan Service Industry today (3rd January). It is predicted that the economic slowdown will continue until May next year. The declination of the indicators are slowing down, and physical investment and finance have continued to increase. If the stagnation may improve, the creation of effective demands or the development of new markets and new consumption power will be needed.
The chart below shows the forecast of this cycle indicator system. The Cyclical Coincidental Composite Index for Service Industries will continue to decline at a slower rate until May. This will be the 17th consecutive month of decline since the cyclical trend began to fall below the long-term trend level in January 2019, but the decline is relatively milder than in the past, and it seems that the declining has come to an end. This should be related to the return of Taiwanese business, driving private investment, also the government's practice of economic incentives.
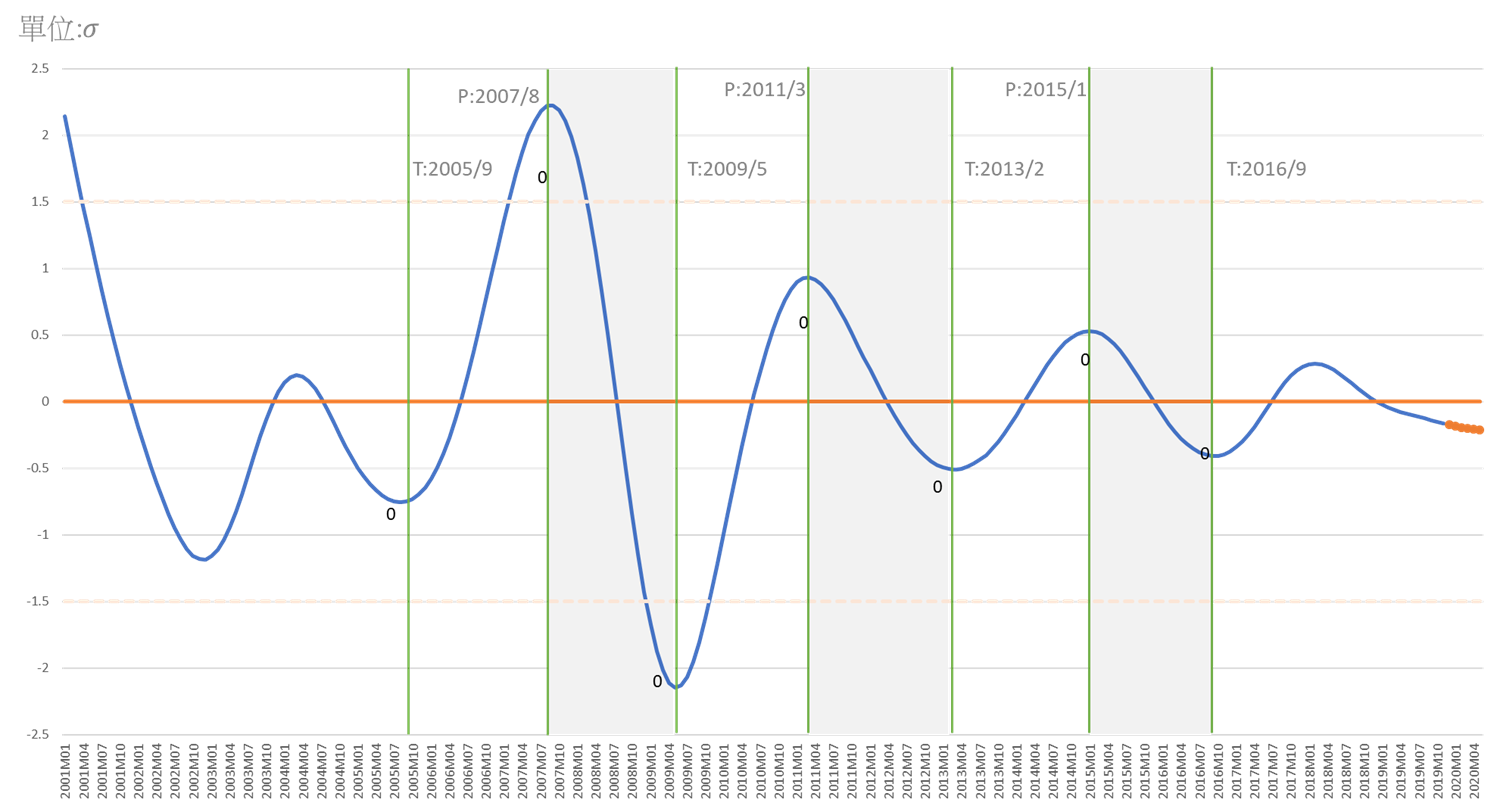
Chart 1 Trend and Forecast of the Business Cycle Coincident Composite Index
The second chart below compares the overall cyclical trend of overall GDP and service industry GDP. Until Q3 2019, the overall GDP has stopped falling and rose in April 2019, but the service industry GDP has continued to decline, indicating that private investment driven by the return of Taiwanese business is beginning to drive the growth of the overall economy. The government should find effective ways to boom the service industry.
National Business Standard Cycle of National Development Council National Real GDP
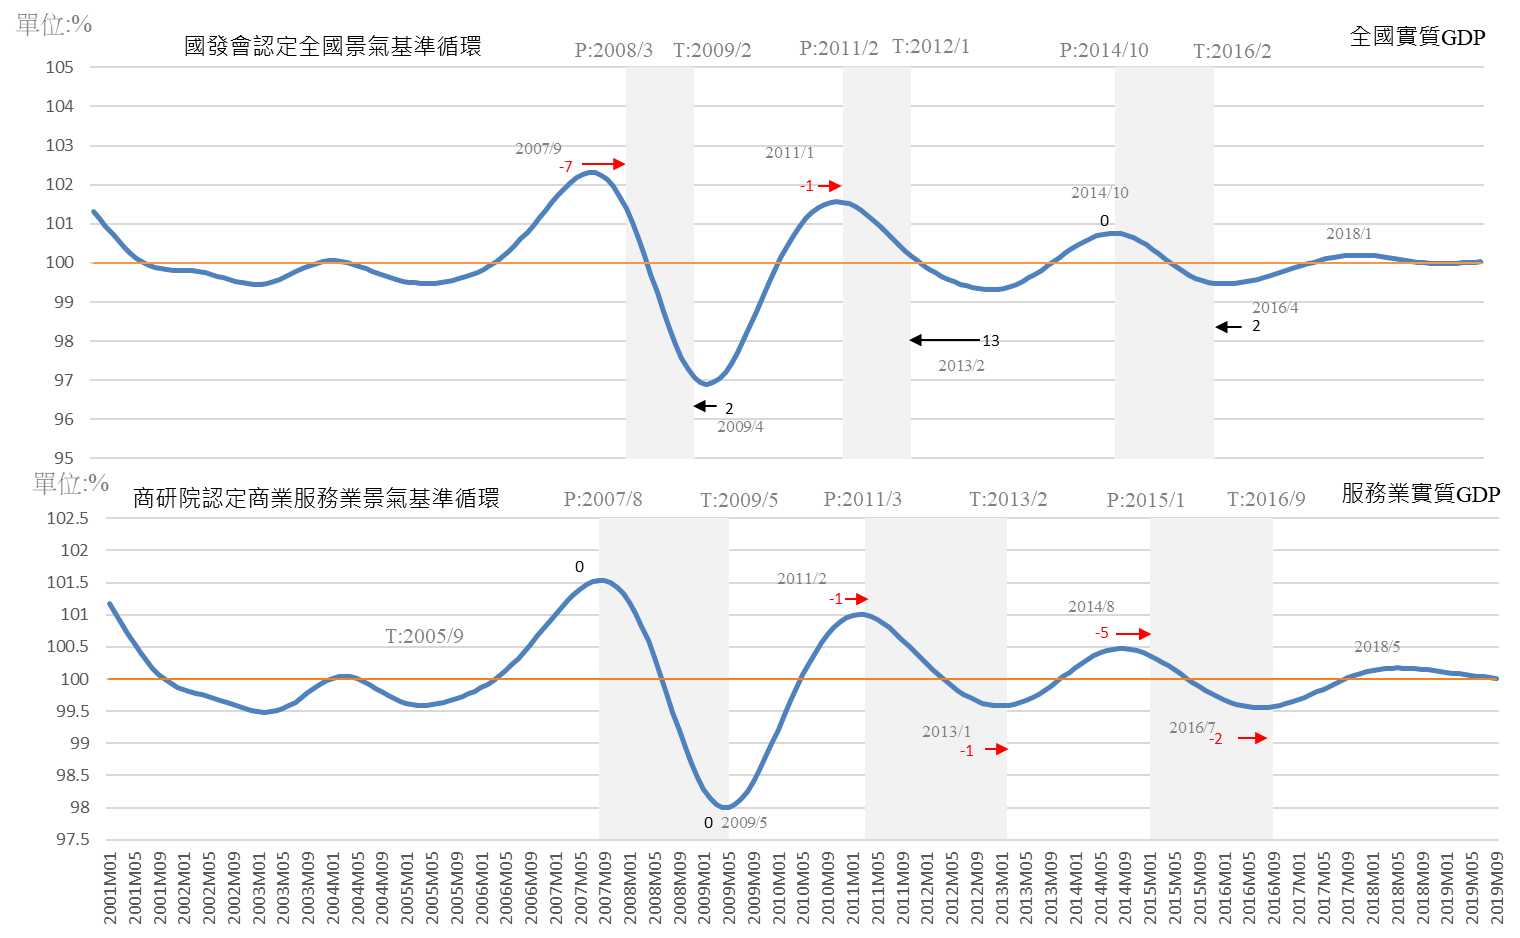
Commercial Service Industry Business Standard Cycle of CDRI Real GDP of Service Industry
Chart 2
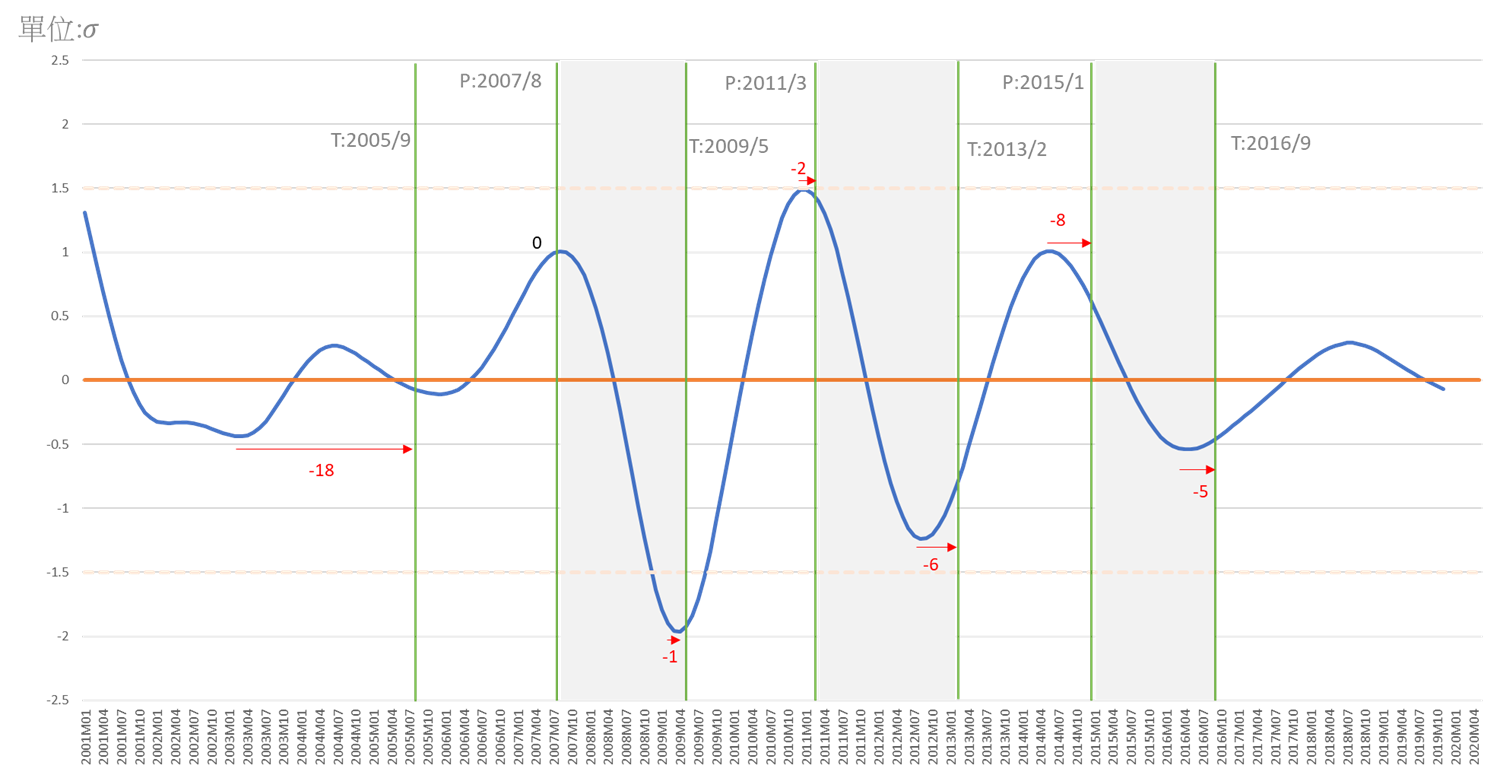
A. The actual value of Cyclical Leading Composite Index for Service Industries(long-term trend excluded)peaked in August 2018, and then continued to decline until November 2019. Its slowdown began to ease in May 2019, because of the "Private Real Fixed Capital Formation" started to rise in March 2018, and began to exceed the long-term trend value (100 in January 2019). By November it was as high as 102.81. The long-term deficit of the service industry trade has also been reduced since January 2017. The circular trend value began to exceed the long-term trend (100) in August 2018 and reached 100.96 in November 2019. Although other sub-indicators, including transportation and warehousing, employment, and the stock market continued to decline, the overall service industry business cycle leading composite index decline rate has therefore significantly slowed.
B. The overall commercial service industry business forecast is expected to continue to decline until May 2020, but the slowdown seems to be ending.
The business cycle index of "real GDP of real estate and residential services" and "real consumption of residential services, hydropower gas and other fuels" continued to increase slightly, but according to the Q2 2019, the government revised the GDP statistics. After analysis, it is found that both of them have gradually decreased. The "finance and insurance real GDP" has continued to decline and started to rise in May 2019. The "real GDP of the wholesale and retail industry" and "number of employees in the service industry" continued to decline slowly as before.
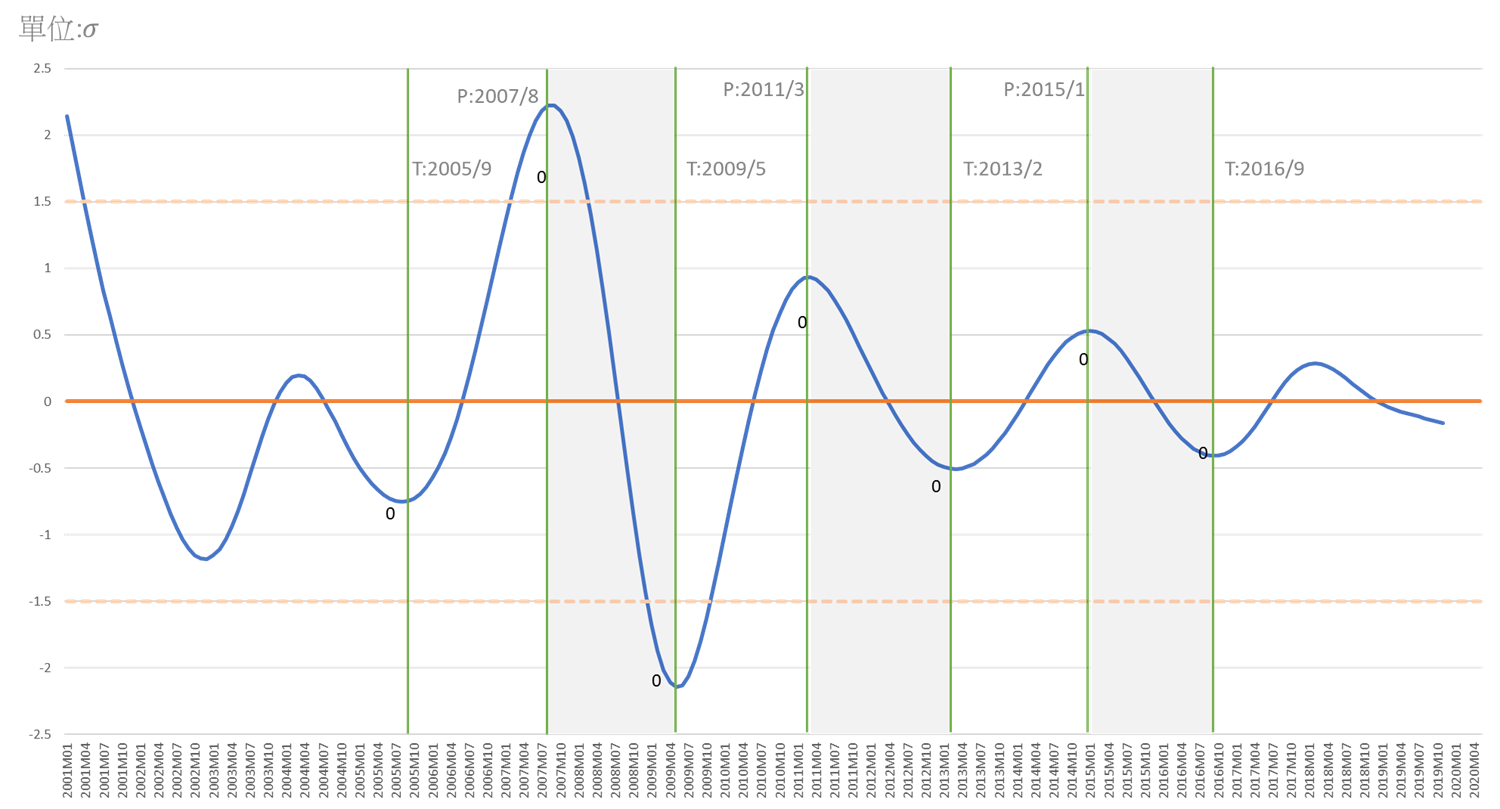
The comprehensive index of the prosperity cycle peer index has turned downward and continued to decline in March 2018. Its decline accelerated in the second half of the year and reached a peak in the first half of last year. It has slowed significantly in Q3 and is expected to slow down again. Besides, the statistic of the actual value in Q2 last year was better than the original estimation, showing that the overall situation is not as pessimistic as before. Although there are no signs of reversal, it is predicted that the slowdown in April this year will be less than 40% in Q3 this year. The latest forecast is that it may even be reduced to less than 20% in May. The downward trend in the business services industry seems to be coming to an end.
The Deviation of Standardized Composite indicators is represented as the Units of Standard Deviation.From the peak positive 0.29 standard deviations (σ) in February 2018 to negative 0.02 standard deviation (σ) in January 2019, and then negative 0.14 standard deviation in September 2019, it is predicted that it will continue to fall to negative 0.2 standard deviation in May this year. It shows that the business trend continues to decline, but the speed has been slowed down. To strive for early recovery, measures to stimulate the business can be strengthened. Especially in the world of the digital economy as today. It is generally acknowledged that investment in new digital technologies and the use of business models are the main drivers of economic growth. Fiscal expenditures or financial easing policies must be matched with or through the role of digital transformation to take effect. With the blessing of the 5 + 2 policy, we have seen progress in digitization and digital optimization, but then the usage of digital transformation has not been practised. The digital transformation of the government and private enterprises should be launched as soon as possible.
Business Cycle Coincident Composite Index for Taiwan Service Sector
|
Year/Month
|
Cycle Indicators
(Unit: σ, Benchmark: 0)
|
Remark
|
|
2020-05
|
-0.2089
|
(P)
|
Prediction based on the lead effect for six months of the ARMA Model:(4,0) (0,0)
|
|
2020-04
|
-0.2067
|
(P)
|
|
2020-03
|
-0.2015
|
(P)
|
|
2020-02
|
-0.1940
|
(P)
|
|
2020-01
|
-0.1846
|
(P)
|
|
2019-12
|
-0.1739
|
(P)
|
|
2019-11
|
-0.1623
|
(f)
|
The estimated value of the coincident composite index
|
|
2019-10
|
-0.1502
|
(f)
|
|
2019-09
|
-0.1380
|
(a)
|
The actual value of the coincident composite index
|
|
2019-08
|
-0.1257
|
(a)
|
|
Source: Business Cycle Forecasting Team, CDRI
|
|
Note:
|
|
a
|
(actual)
|
|
|
|
f
|
(estimated)
|
|
|
|
p
|
(predicted)
|
Business Cycle Composite Index for Taiwan Service Sector
Source: Business Cycle Forecasting Team, CDRI
Previous Cycle:
|
Cycle
|
Trough
|
Peak
|
Trough
|
|
1
|
2005/9
|
2007/8
|
2009/5
|
|
2
|
2009/5
|
2011/3
|
2013/2
|
|
3
|
2013/2
|
2015/1
|
2016/9
|