Authors:Tain-Tsair Hsu(許添財)Shih-Hsien Chen(陳世憲)
【Abstract】
In Q4 2021, the Coincidental Cyclical Composite Index for Service Industry (CCCIS) showed a continuous decline and didn’t bottom out in October 2021 as predicted from the previous report. However, newly revised GDP statistics from Q3 and raw data for Q4 showed that its rate of decline was much slower than the original statistics and predictions.
Until now (January 2022), the CCCIS has been declining since September 2020 while the leading cyclical composite index has been rising since July 2020. This shows it is missing the conventional correlation of periodical regularity from the leading indicators to coincident indicators, thus implying that the domestic market in Taiwan, which has been relatively weak for a long time, is suffering from severe impacts of exogenous factors such as the raging pandemic, geopolitical conflicts, and extreme climate. Despite having the world’s best of manufacturing production and export growth, and a high overall economic growth, Taiwan’s private consumption is sluggish, and the commercial service industry is bearing the brunt.
The repeated bailout and revitalization measures from the government might have an immediate effect. Despite this, it is still hard to see the real effect of industrial transformation and domestic demand upgrade. The impacts of the global pandemic have not yet subsided while the threat of extreme climate has remained unabated. Meanwhile, intensified geopolitical conflicts such as the large-scale Russian invasion of Ukraine this year, followed by the international economic and financial sanctions against Russia imposed by the United States, Canada, the European Union, Japan, and Australia resulted in the crude oil and commodities prices soaring. This global economy is very possibly facing its first threat of stagflation since the 1970s oil crisis.
To strengthen the domestic market, some economic measures are recommended. The government should have better collaboration with private enterprises and adopt various kinds of “import substitutions” for supply and demand. “Digital transformation” and “ESG” business management should be combined to vitalize productivity and international competitiveness for the service industry. Finally, the overdependence on specific foreign markets needs to be reduced to make economic development “sustainable”.
1. Comprehensive analysis and prediction
The Commerce Development Research Institute (CDRI) finds that the CCCIS has further dropped to -0.6412 standard deviations in January 2022. CDRI also predicts that it would drop continuously to -0.8050 standard deviation by July 2022. (See Figure 1 and the appendix below)
Figure 1. “Tendencies and Forecasts of the Coincidental Cyclical Composite Index for the Service Industry”
Source: Business Cycle Forecasting Team, CDRI
A discrepancy amongst data for different sectors and industries during the economic recovery in 2021.
The recurrence of the pandemic last year (2021) has further damaged those who had suffered in 2020. However, the overall economic growth rate of 2021 is still high at 6.45%, mainly thriving from the manufacturing industry (see Table 3). The overall economic growth rate in the second half of the year is not as vigorous as it was in the first half again. (The economic growth rates in Q1-Q4: 9.2%, 7.76%, 4.37%, 4.86%; the growth contribution of service industry is relatively lower either, Q1-Q4: 3.94%, 2.52%, -0.42% and 1.56%)
The Directorate General of Budget, Accounting and Statistics, Executive Yuan announces that the momentum of the private investment is keeping strong, with a high growth rate of 19.05%, and its growth contribution reaches 3.75%, which has returned to the top of the record among the growth contributions of all sectors; the private consumption is the weakest as -0.38%, and the growth contribution is -0.18%. (See Table 2)
Table 2. The economic growth rate, and growth contribution rate of each sector in 2021
Unit: Millions of New Taiwan Dollars; %
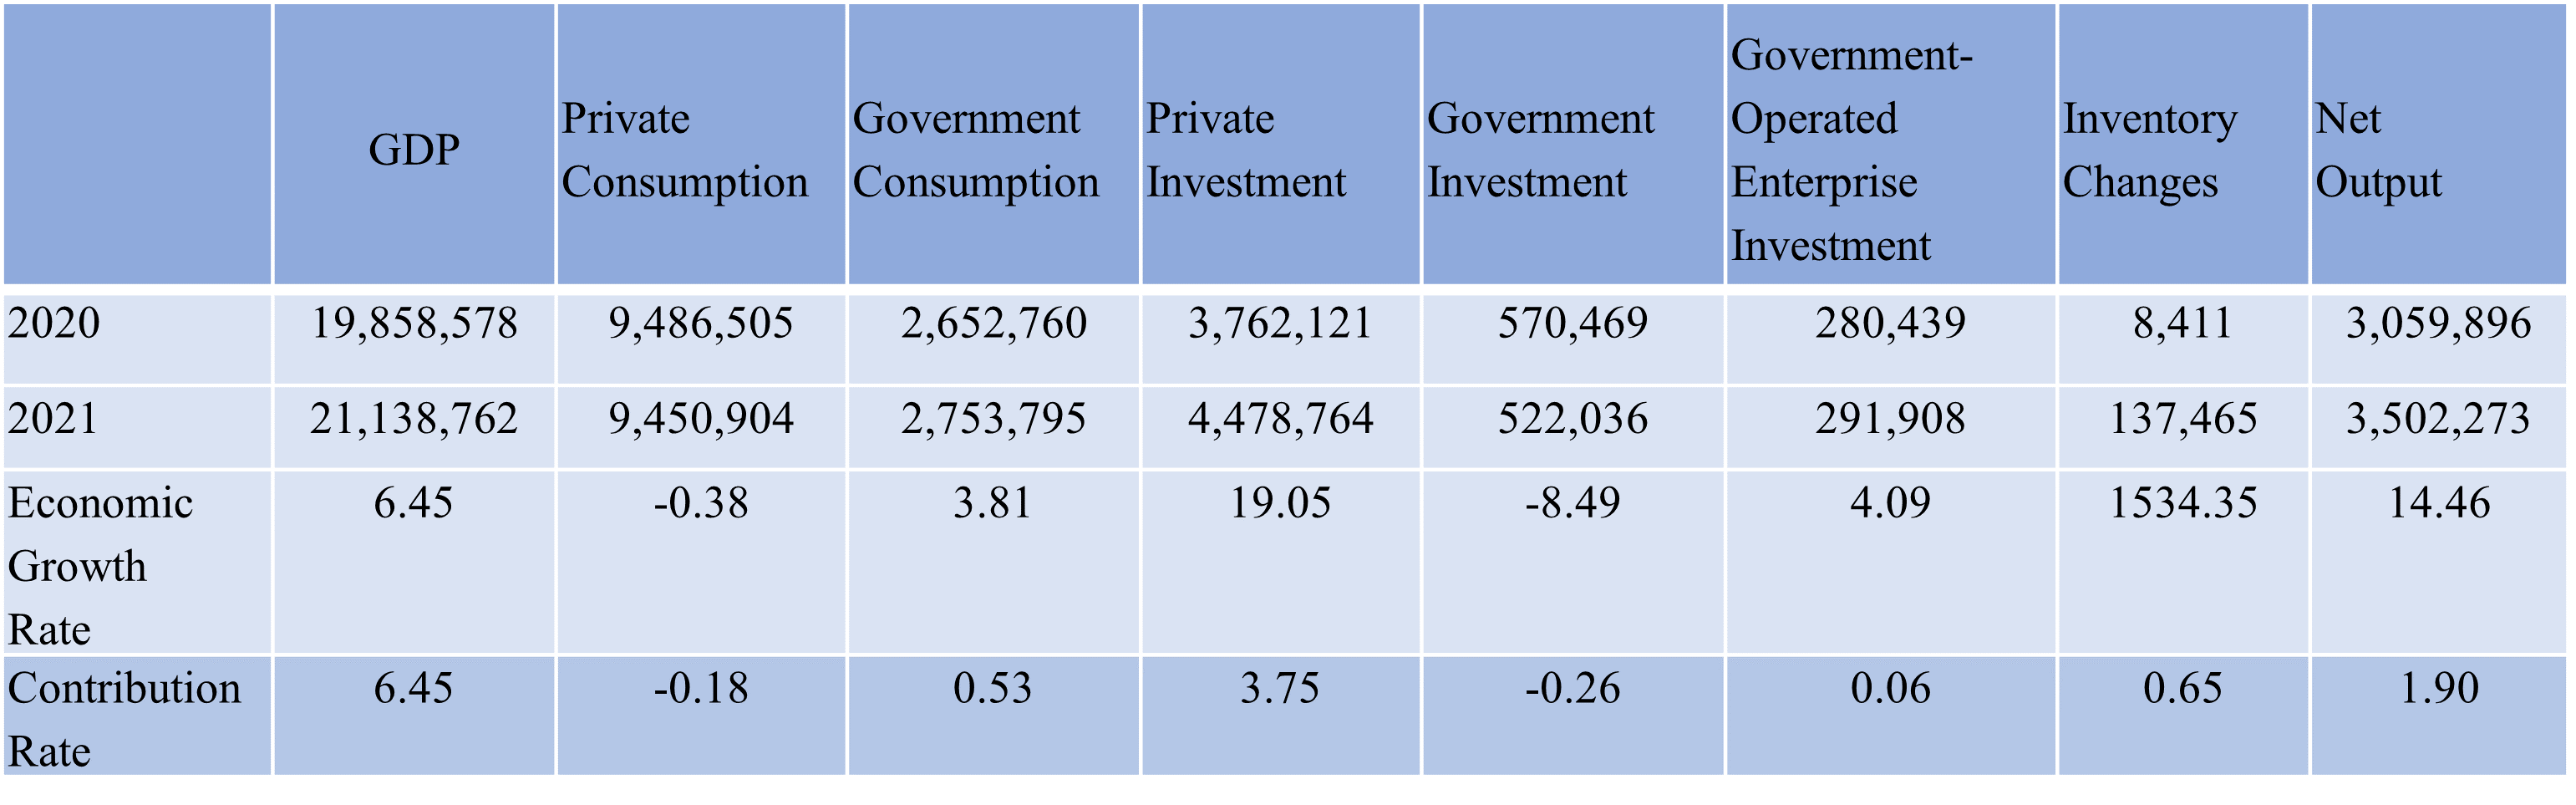
Source: The Directorate-General of Budget, Accounting and Statistics, Executive Yuan, and the Business Cycle Forecasting Team of CDRI
Table 3. The economic growth rate and growth contribution rate of each industry in 2021
Unit: Millions of New Taiwan Dollars; %
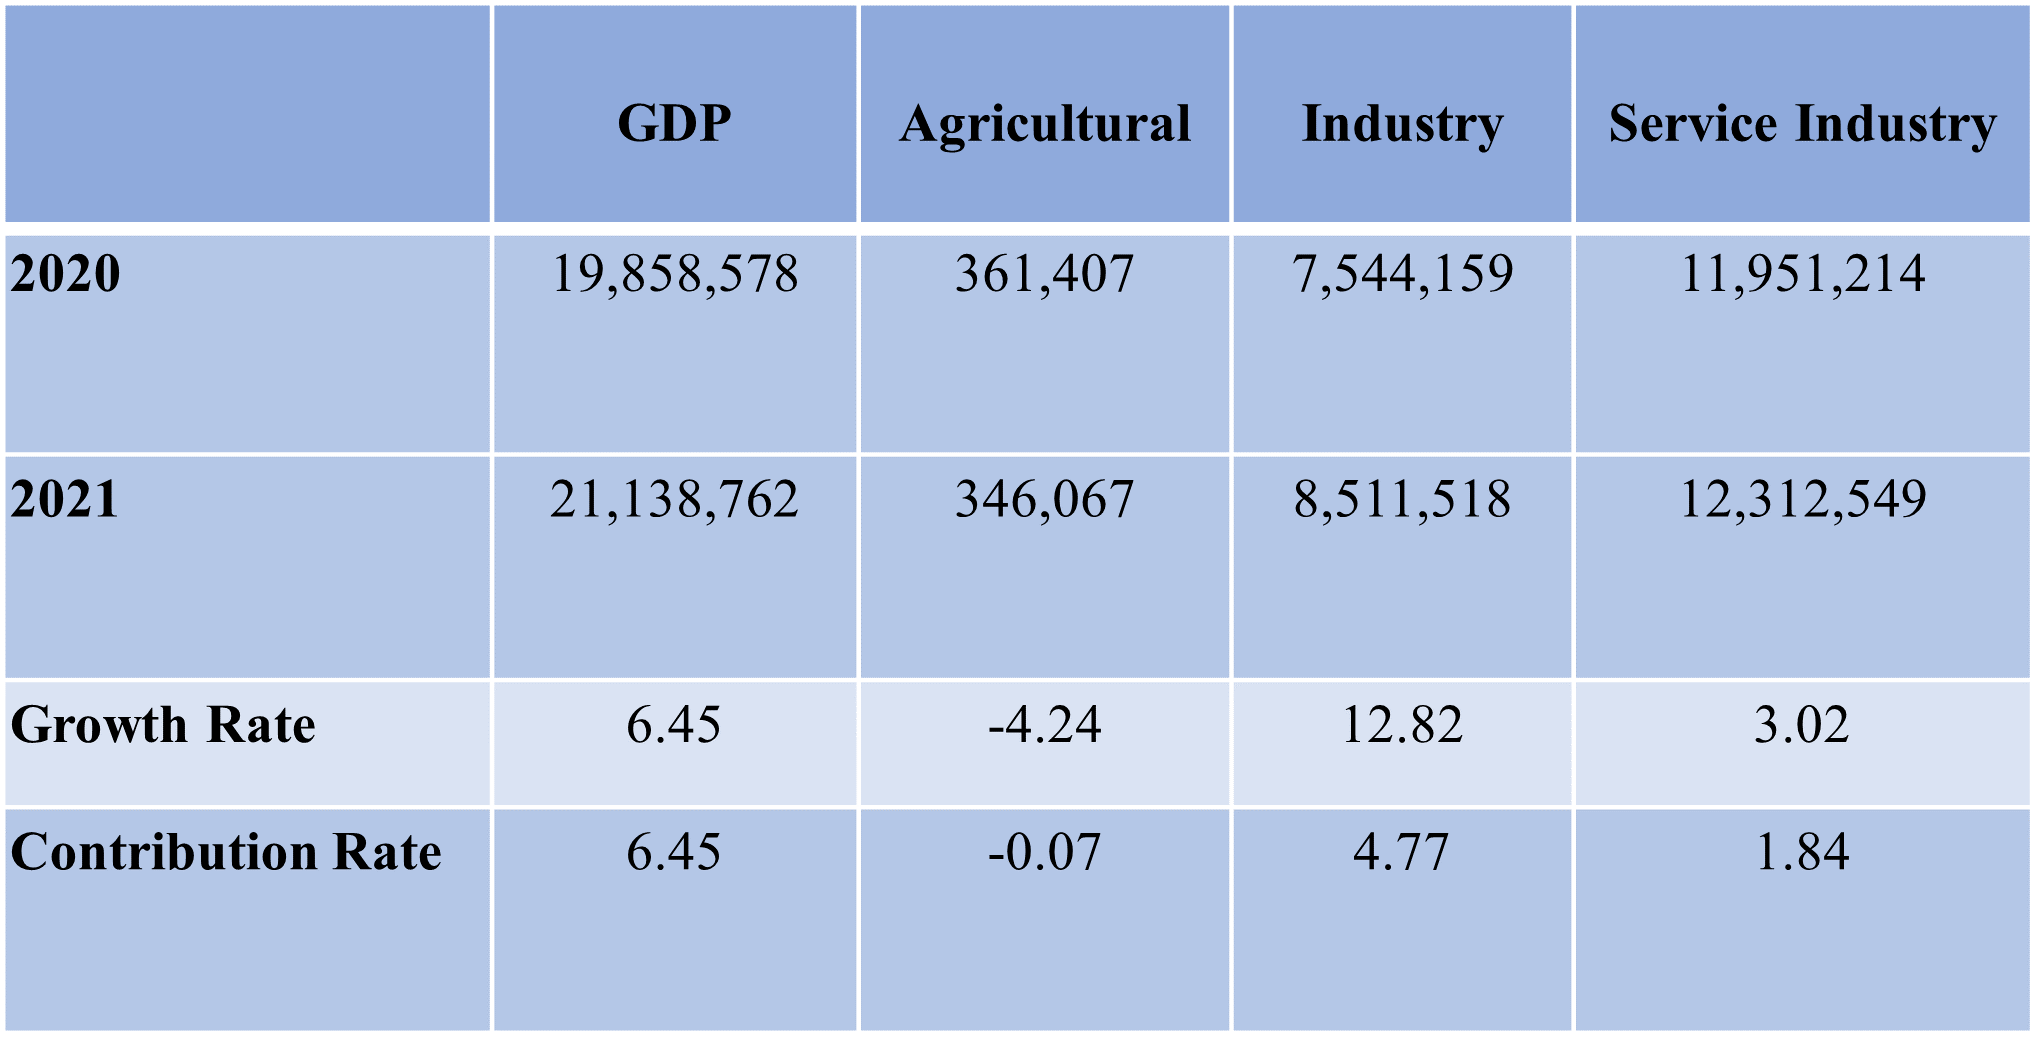
Source: Directorate-General of Budget, Accounting and Statistics, Executive Yuan, and calculated by the Business Cycle Forecasting Team of CDRI
A cross-examination of sectors and industries reveals that under the impacts of the pandemic, private enterprises have been prospering in investment, manufacturing, and exports. While domestic demand for private products and service consumption is extremely sluggish, resulting in serious imbalances.
2. The outlook of business cycle for service industry
The compilation of the composite index system of the business cycle is based on the research of the business cycles. We analyze the relevant economic indicators in time series and screen out those with the significance of the business cycle and the stability of their cyclicality. It is classified into leading indicators, coincident indicators and lagged indicators by statistical analysis and verification. It has proved that the cyclical trend of the composite index of coincident indicators is highly correlated with the cyclical trend of GDP, and the forecast value of the composite index of the coincident indicators, estimated by the leading indicator composite index, could be used to forecast the moving trends of GDP.
The cyclical trend of economic indicators fluctuates around the long-term trend. The long-term trend value is set as 100, and the cyclical trend value is greater than 100 in the recovery or prosperity stage; and below 100 in the recession or depression stage.
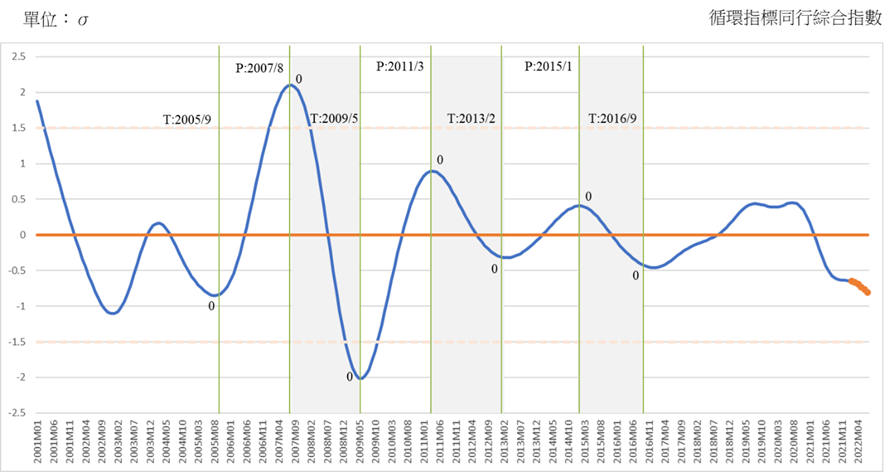
The standardized changes of indicators’ cyclical trend values (in standard deviation unit) are added up to become a composite index, and it fluctuates around the long-term trend value with a standard deviation of 0. The leading and coincidental composite indices curve of this business cycle indicator system is shown in Figure 2.
Leading cyclical composite index (LCCIS) bottomed out in May 2020 and has been lasting for 19 months, until January of this year. Meanwhile, its indices changed from a negative 0.7315 standard deviation in May 2020 to a positive 0.0667 standard deviation in May 2021 and further reached to positive 1.1562 standard deviation in January this year.
Looking at the diffusion situations of the leading indicators, it shows that there are 5 out of 7 indicators that keep rising, while only the other 2 sub-indicators continue to remain falling.
Coincidental cyclical composite index (CCCIS) has been directly affected by the pandemic, falling from a positive 0.4535 standard deviation at its peak in August 2020 and becoming a negative 0.0753 standard deviation in March 2021, and further fell to a negative 0.6412 standard deviation in January this year. (Without the ongoing tendency change itself, it is predicted to continue to drop to -0.8050 standard deviation by July this year. [See Figure 1 above and the appendix attached below])
Looking at the diffusion situation of the coincident indicators, there are still three out of five sub-indicators that are declining, while only other 2 sub-indicators remain rising.
Figure 2. The trends of Leading and Coincidental Cyclical Composite Index for the Service Industry
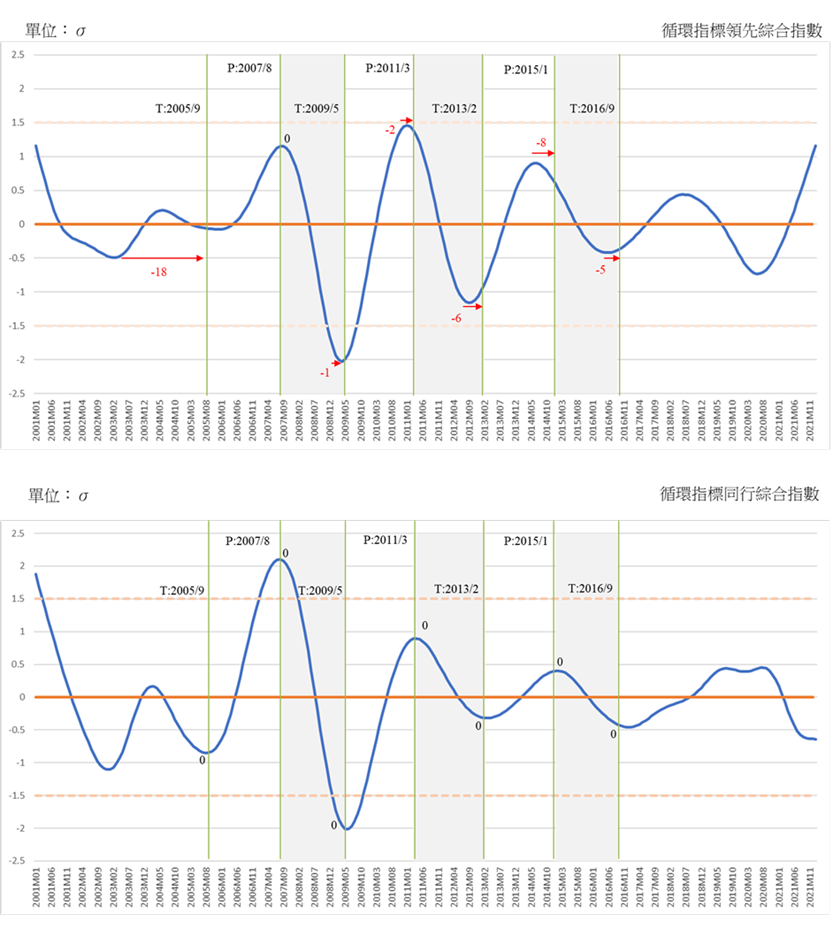
Source: Business Cycle Forecasting Team, CDRI
A. Leading indicator series
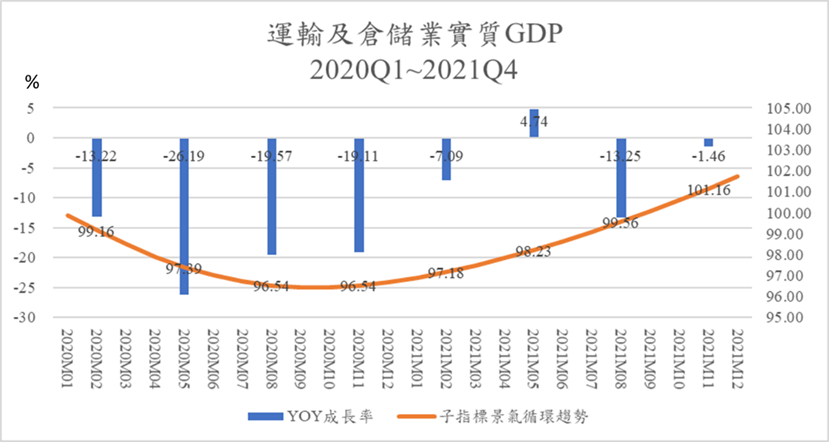
a. Real GDP of the Transportation and Storage Industry has not rebounded enough out of the doldrums.
The cyclical tendency value of this sub-indicator reached bottom, 96.46, in September 2020, and then rose to 100.07 (the estimated value) in September last year, further up to 102.27 in January this year by extrapolation. Obviously, the uptrend has accelerated in the second half year in 2021, as the cyclical tendency value has exceeded the long-term trend level (100).
However, the annual growth rate (YOY), calculated based on its actual value, has still been in negative growth in each quarter since 2020, only once a positive 4.74% turned in Q2 last year (2021). It decreased 13.25% in Q3 and decreased 1.46% in Q4.
Figure 3. The annual growth rate of transportation and storage GDP and the trend of business cycle, 2020Q1~2021Q4
Source: Business Cycle Forecasting Team, CDRI and Directorate General of Budget, Accounting and Statistics, Executive Yuan
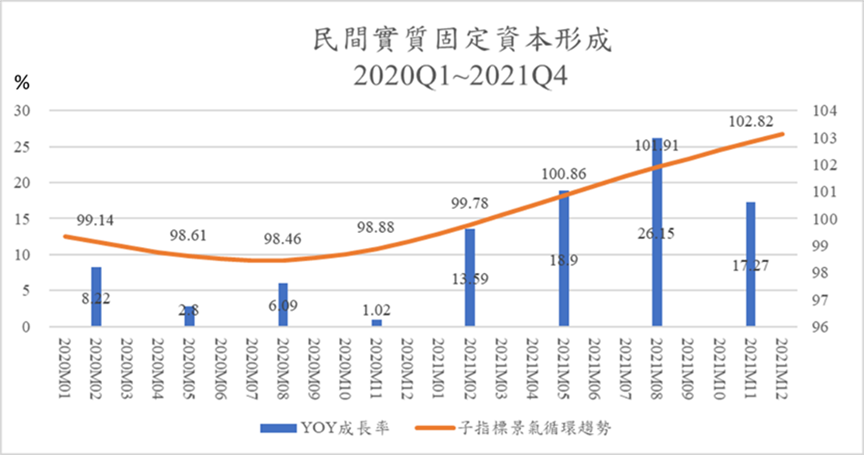
b. The Private Real Fixed Capital Formation
The cyclical tendency value of this sub-indicator reached its lowest point, 98.45, in July 2020, and then exceeded the long-term trend value of 100 in March last year. It reached 103.41 (the extrapolated value) in January this year, showing that it surpassed the stagnation period, and has kept on strongly recovering.
The annual growth rate (YOY), calculated based on its actual value, has been in positive growth in each quarter since 2020. What’s more, the four quarters of last year have increased by 13.59%, 18.9%, 26.35% and 17.27%, respectively.
Figure 4. Annual growth rate and cyclical trend of private real fixed capital formation, 2020Q1~2021Q4
Source: Business Cycle Forecasting Team, CDRI and Directorate General of Budget, Accounting and Statistics, Executive Yuan
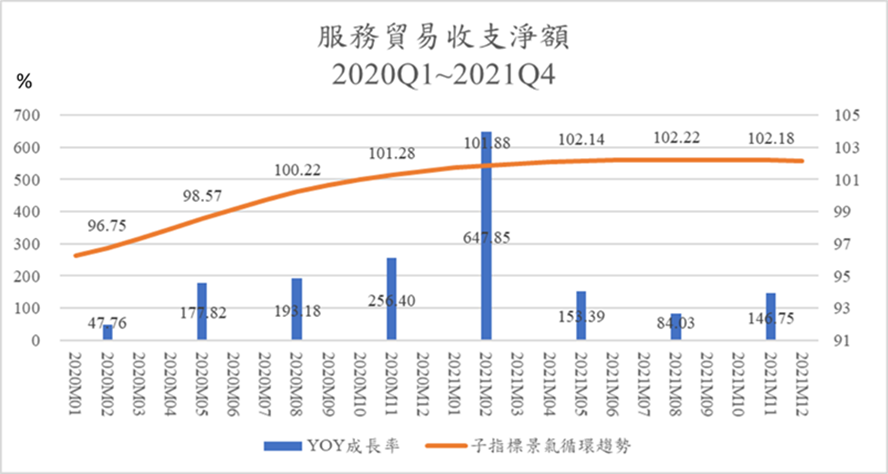
c. Net trade balance in services revenue and expenditure, cyclical tendency value exceeding long-term trend value
The cyclical tendency of this sub-indicator reached the lowest, 95.38, in September 2019, and then rose all the way, reaching the long-term trend level in August 2020, with an index of 100.22. It reached the top in August 2021, and slightly turned down to 102.15 in January 2022 (extrapolated). The trade services of Taiwan, which had a long-term deficit, had a great improvement of the net services trade balance after the global pandemic blocked the mobility of international tourism in 2020, and then turned into a surprising trade surplus in Q2 2020. The net trade balance in services revenue and expenditure in Q1 last year reached its historical high, with a 647.85% growth rate (YOY). It dropped to 153.39% in Q2 and 84.03% in Q3 and rebounded to 146.75% in Q4. It shows that the improving path of the service trade revenue and expenditure has slowed down since Q2 last year.
Figure 5. Annual growth rate and cyclical trend of net trade in services revenue and expenditure, 2020Q1~2021Q4
Source: Business Cycle Forecasting Team, CDRI and Directorate General of Budget, Accounting and Statistics, Executive Yuan
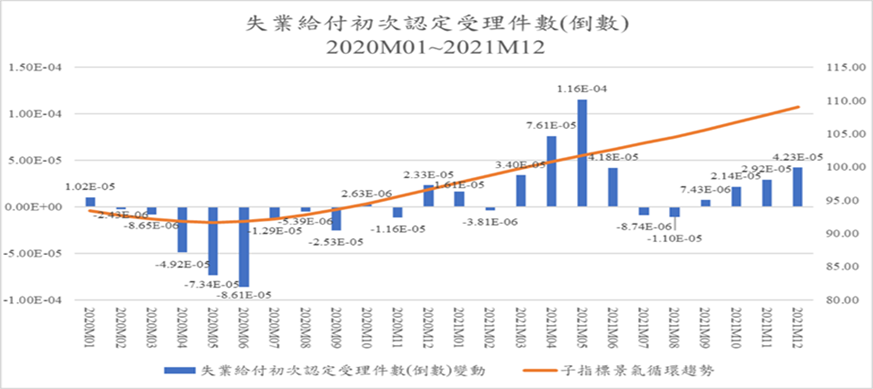
d. The initial acceptance of unemployment benefits (inverted) shows the unemployment pressure is alleviating
The cyclical tendency of this sub-indicator reached its lowest, 91.64, in May 2020, and then rose all the way, exceeding the long-term trend value of 100 in April 2021, and reaching 110.18 in January this year. It indicates that the employment demand rapidly increases due to the large amounts of investment from the return of Taiwanese businessmen. Therefore, the number of people applying for unemployment benefits for the first time, a leading indicator to the unemployment rate, has dropped significantly. This should basically be an indicator of the overall economy. But it is not necessary to be a phenomenon that may occur in the service industry. However, compared with the net entry rate of employees in commercial service industry below, which business cycle index exceeding the long-term trend value in July last year, it shows that the leading indicators of employment in the service industry has indeed been improving significantly.
Figure 6. Number of the initial acceptance of unemployment benefits (inverted) and the annual growth rate and cyclical trend January 2020 to December 2021
Source: Business Cycle Forecasting Team, CDRI and Directorate General of Budget, Accounting and Statistics, Executive Yuan
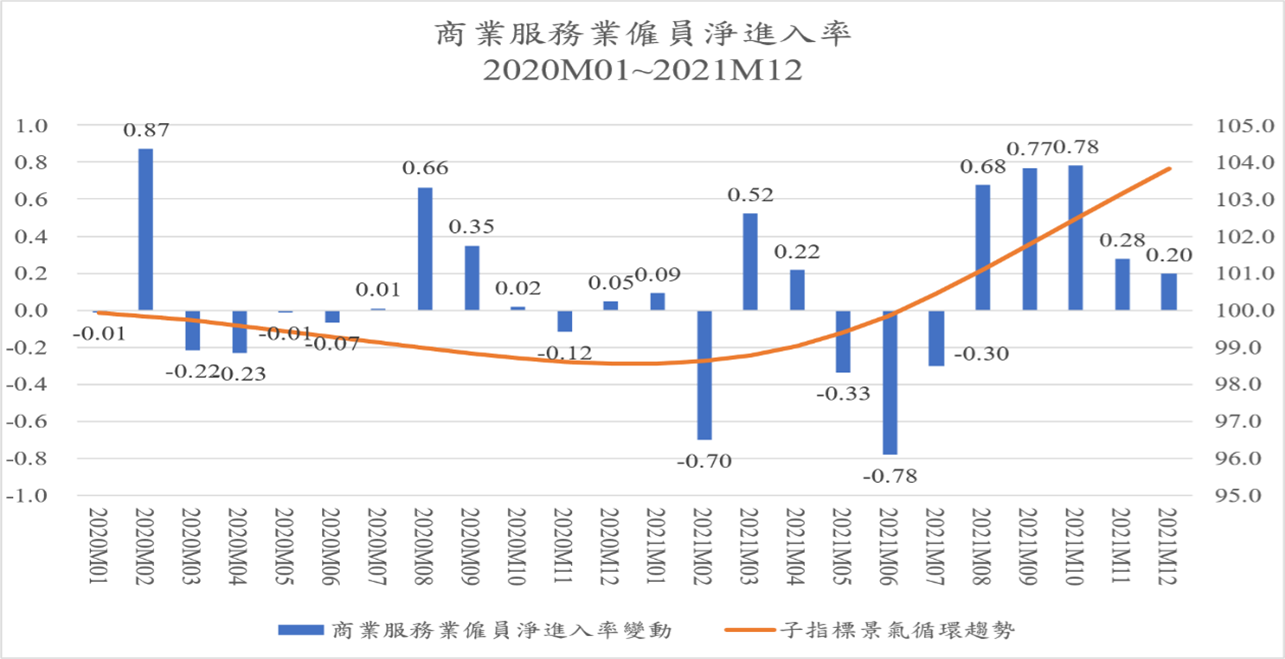
e. The net entry rate of employees in the commercial services industry-the business cycle trend that crosses the long-term trend value will lead to employment improvement.
The cyclical tendency of this sub-indicator reached its peak, 100.48, in August 2018, and then fell all the way. It started to be below the long-term trend level in December 2019, and reached 98.55 in December 2020, and then rebounded all the way of the year reaching 104.50 in January this year. It shows that employment demand in the service industry has once been severely impacted by the pandemic, which is contrary to the boom in the manufacturing industry. Meanwhile, the changes in the actual value of this indicator during this period also showed a downward trend. But then it stopped falling and rebounded in January last year. After a year-long acceleration, it is already up to 104.50 in January of this year. When the leading indicator has rebounded, the coincident indicator of total employment and the lagged unemployment rate would improve after a certain period of time as well.
Figure 7. Annual changes and cyclical trends in the net entry rate of employees in the commercial service industry, January 2020 to December 2021
Source: Business Cycle Forecasting Team, CDRI and Directorate General of Budget, Accounting and Statistics, Executive Yuan
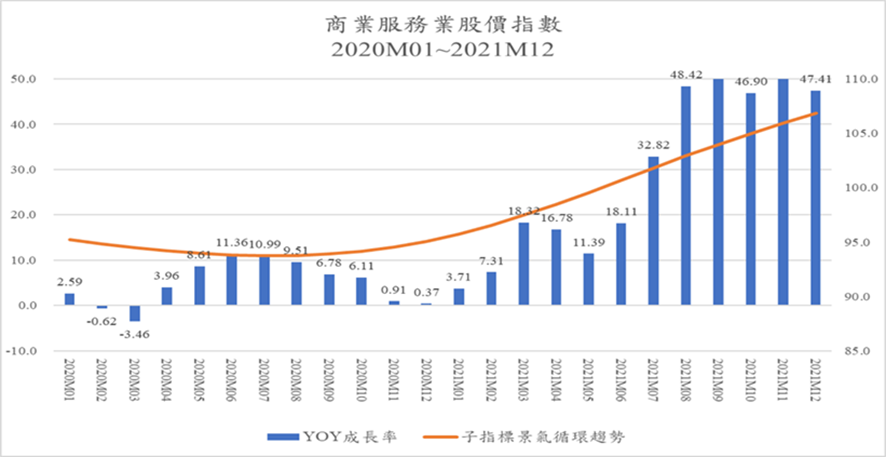
f. The stock price index of the commercial services sector
The cyclical tendency of this sub-indicator reached the lowest, 93.72, in July 2020, and then kept rising all the way, exceeding the long-term trend level in June last year, and reached 107.76 by January of this year. This reflects the prosperity of Taiwan’s general stock market in the past year and a half. The impact of the pandemic has accelerated the development of digital transformation, which contributes to the investment and development of the commercial service industry, and in turn makes the relevant commercial service industry stock market promising.
Take a look at the annual growth rate of the actual stock price index. It has seen double-digit growth since March last year and even reached 32.82% and 48.42% in July and August, respectively. In September and October, the growth rate came to 50% and 46.9%, and another 50% and 47.41% in November and December.
Figure 8. The annual growth rate and circular trend of the stock price index of the commercial service industry, January 2020 to December 2021
Source: Business Cycle Forecasting Team, CDRI and Directorate General of Budget, Accounting and Statistics, Executive Yuan
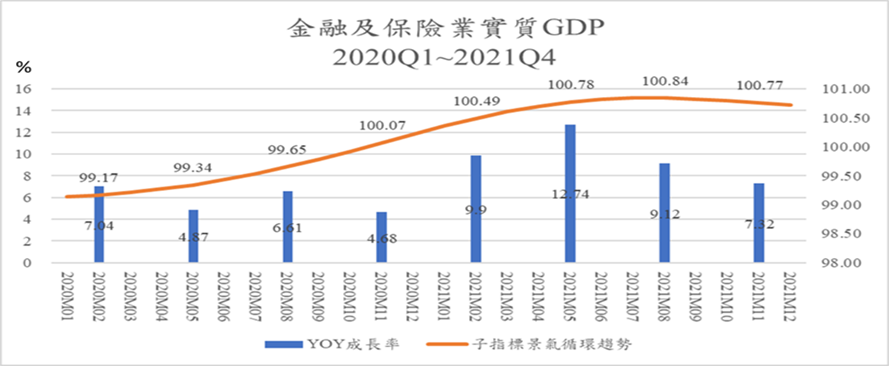
g. The Real GDP of Finance and Insurance Sector-continues to recover slightly
The cyclical tendency of this sub-indicator was out of the trough at the end of 2020. The business cycle index began to exceed the long-term trend value (100) at 100.07 in November 2020, and continued to rise slightly, reaching the top with 100.84 in August 2021, and then slightly decreased. It reached 100.69 (the extrapolated value) by January this year.
The annual growth rate (YOY), calculated based on its actual value, has been in positive growth since last year. The growth rate in each quarter last year were: 9.9%, 12.74%, 9.12% and 7.32%. The positive annual growth rate of its GDP is consistent with its upward cyclical trend. However, the relatively low cyclical trend value unparalleled to the high growth rate of actual value of GDP seems to imply that the long-term trend of this indicator is considerably steep, that is, its structural change is significant.
Figure 9. Annual growth rate and cyclical trend of real GDP of Finance and Insurance Sector, 2020Q1~2021Q4
Source: Business Cycle Forecasting Team, CDRI and Directorate General of Budget, Accounting and Statistics, Executive Yuan
B. Coincident indicator series
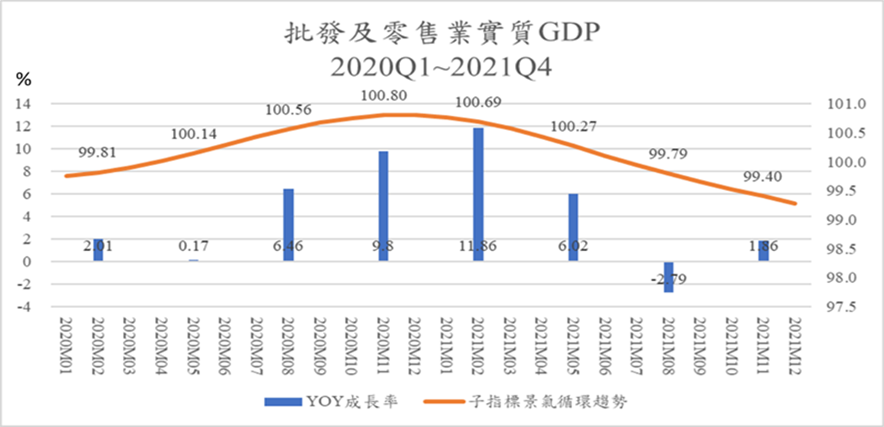
a. Real GDP index of wholesale and retail-The business cycle started to drop, seeing negative growth in Q3 last year.
This cyclical tendency of this sub-indicator reached its bottom in October 2019, with an index of 99.70. After a year of slow recovery, it reached 100.8 in December 2020. Then it fell all the way down in 2021. It was lower than the long-term trend value (100) in July last year, and by December, it had fallen to 99.28, and dropped to 99.16 (the extrapolated value) in January this year.
Meanwhile, the actual annual growth has shown a row of positive rates from 2020 to the first half of 2021. While Q3 last year saw a negative growth of 2.79% for the first time and slightly returned to a positive growth of 1.86% in Q4.
Figure 10. Annual growth rate and cyclical trend of real GDP index of wholesale and retail, 2020Q1~2021Q4
Source: Business Cycle Forecasting Team, CDRI and Directorate General of Budget, Accounting and Statistics, Executive Yuan
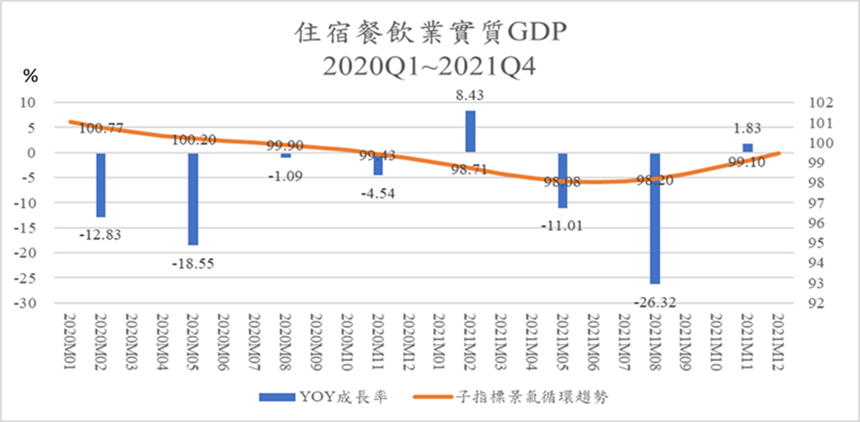
b. Real GDP of the accommodation and catering industry- declined since the beginning of last year, slightly recovered in Q4
The industry has been greatly impacted by the pandemic. The cyclical tendency of this sub-indicator peaked in May 2019 with an index of 102.79, and then fell all the way. It was lower than the long-term value in July 2020 and continued to fall to the bottom as 98.01 in June last year, then showed a slight rise, reaching to 99.82 (the extrapolated value) in January this year.
Take a look at the annual growth rate of real value. Except for the growth rate of 8.43% in Q1 (2021) last year, there were negative 11.01% in Q2, and 26.32% in Q3 and only a slight growth of 1.83% in Q4.
Figure 11. The annual growth rate and circular trend of real GDP in the accommodation and catering industry, 2020Q1~2021Q4
Source: Business Cycle Forecasting Team, CDRI and Directorate General of Budget, Accounting and Statistics, Executive Yuan
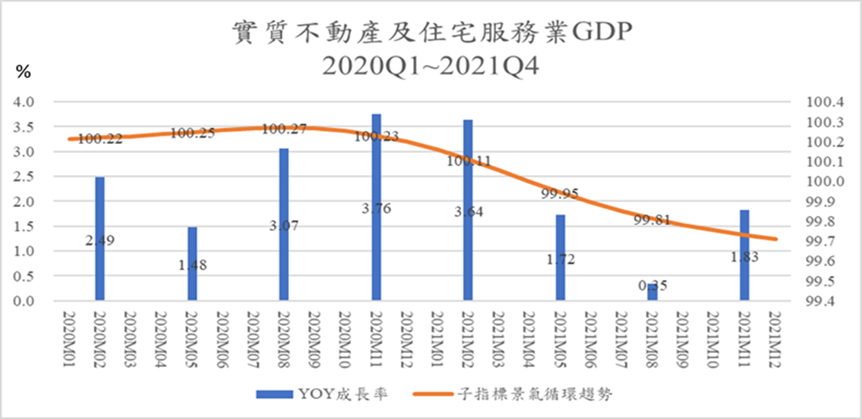
c. Real GDP of real estate and residential service industry- business cycle trend continues to be sluggish
The cyclical tendency of this sub-indicator fluctuates slightly over a long period of time. The index peaked in August 2020, with an index of 100.27 and then showed a series of slight declines. It was lower than the long-term trend until May 2021 and continued to decline with 99.69 (the extrapolated value) in January this year.
The actual annual growth rate has shown a continuing positive growth in a row. However, it has slowed down through Q2-Q4 last year.
Figure 12. Annual GDP growth rate and cyclical tendency of real estate and residential service industry, 2020Q1~2021Q4
Source: Business Cycle Forecasting Team, CDRI and Directorate General of Budget, Accounting and Statistics, Executive Yuan
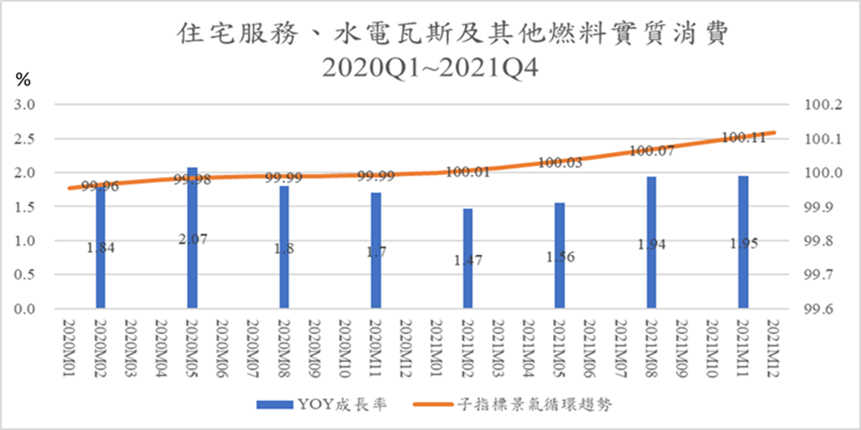
d. Residential services, utilities, and other fuel industries- continues to grow slightly
The cyclical tendency of this sub-indicator has a little long-term fluctuation. It reached the bottom in March 2019, with an index of 99.89, and then kept rising slightly all the way, reaching 100.13 in January this year (extrapolated). Meanwhile, the actual annual growth rate has seen a slightly positive growth since 2020. However, it was never higher than 2%.
Figure 13. Real consumption of residential services, utilities, and other fuel industries, 2020Q1~2021Q4
Source: Business Cycle Forecasting Team, CDRI and Directorate General of Budget, Accounting and Statistics, Executive Yuan
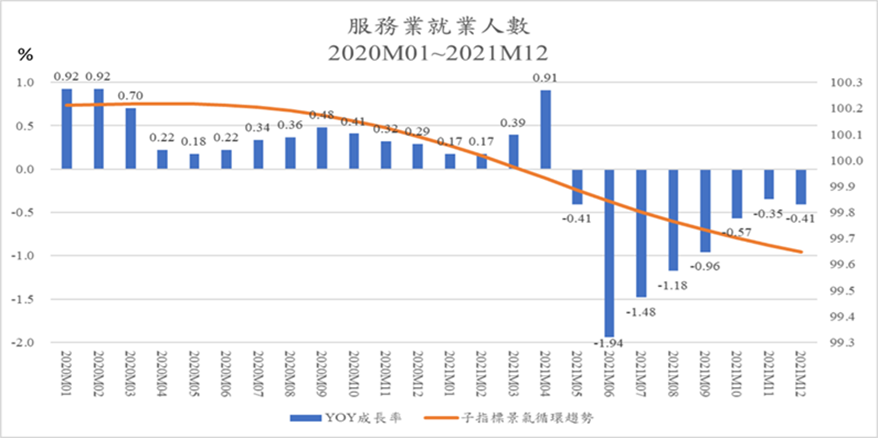
e. Number of employees in the service industry- affected by the downward trend and has continued to decrease since May last year.
The cyclical tendency of this sub-indicator peaked in April 2020 with an index of 100.22, and then fell all the way to below the long-term tendency value as 99.98 in March 2021. It only showed a slight decrease, while the decline also slowed down gradually.
The actual annual growth rate has seen a limited positive growth from last year until this April. Even the growth rate peak never hit a high of 1%. It started to grow negatively since May last year, especially in Q2 and Q3 last year. Obviously, it was affected by the recurrence of the pandemic, which has reduced demand for labor due to the recession.
Figure 14. The growth rate and cyclical tendency of the number of employees in the service industry, January 2020 to December 2021
Source: Business Cycle Forecasting Team, CDRI and Directorate General of Budget, Accounting and Statistics, Executive Yuan
C. Lagged indicator series
The lagged indicator includes real consumption of tobacco and alcohol, real consumption of clothing, footwear, and apparel, real consumption of furniture, equipment, and housekeeping, and the number of initial recognition and acceptance of unemployment benefits. The lagged index can be used as a reference for observing whether a business cycle is over. This article omits relevant analysis.
Appendix
Business Cycle Coincident Composite Index for Taiwan Service Sector
|
Year/Month
|
Deviation of Standardized Cyclical Coincident Composite Index
(unit:,Benchmark: 0)
|
Remark
|
|
2022-07
|
-0.8050
|
(P)
|
Use ARMA Model: (4,0)(0,0) to make predictions based on the leading effect set for half year
|
|
2022-06
|
-0.7657
|
(P)
|
|
2022-05
|
-0.7274
|
(P)
|
|
2022-04
|
-0.6939
|
(P)
|
|
2022-03
|
-0.6680
|
(P)
|
|
2022-02
|
-0.6507
|
(P)
|
|
2022-01
|
-0.6414
|
(f)
|
The estimated value of the coincident composite index
|
|
2021-12
|
-0.6370
|
(a)
|
The actual value of the coincident composite index
|
|
2021-11
|
-0.6342
|
(a)
|
|
2021-10
|
-0.6279
|
(a)
|
|
Source: Business Cycle Forecasting Team, CDRI
Note: (a): actual; (f): estimated; (p): predicted
|