Authors: Tain-Tsair Hsu(許添財)Shin-Hsien Chen(陳世憲)
【Abstract】
According to the Coincidental Composite Index of business forecast for service industry published by Commerce Development Research Institute (CDRI) on June 7, the cyclical tendency of Q1 2022 follows the upward trend of Q4 2021 and expected to keep rising until October 2022. However, it is still needed to struggle amid risks of vulnerabilities and volatility.
[The forecast issued by CDRI this time is different from the one on March 4, 2022. The reason is because that the statistics for Q4 2021, which was published on February 27 by the Directorate-General of Budget, Accounting and Statistics, Executive Yuan, have been considerably revised this time. (Most of the leading indicators relating to this system are being revised upward, while most of the coincident indicators are being revised downward. Please refer to the analysis of each sub-indicators below for more details.)]
The calculus analysis of this system shows the leading lags of the Leading Composite Index to the Coincidental Composite Index in both peak and trough of this tentative cycle is 14 months. This much longer time lag than before implies that a few of unusual factors might have existed.
Furtherly, there are some structural changes also observed in the current business cycle analysis.
1. The momentum of further rising for the Leading Index has weakened since Q4 last year; the momentum of the Coincident Index to rise ahead should also tend to slow down in H2 this year.
2. Noting the diffusion of the indicators, it shows that there are 4 out of 7 sub-indicators of Leading Index keep declining in Q1 this year, including GDP of Private Fixed Investment, Trade balance of Service Industry, Finance and Insurance GDP, Stock Price Index of Commercial Service Industry; there are 3 out of 5 sub-indicators of Coincident Index keep declining, including Wholesale and Retail GDP, GDP of Real Estate and Residential Service, GDP of Residential Service, and Utilities, and Other Fuel Industries. While the Number of Employees in Accommodation and Catering Industry turns upward. Thus, the diffusion perspectives suggest that there are some vulnerabilities and volatility still exist in future cyclical changes.
Let’s take a look at the slowdown of the overall economic growth rate in Q1 this year, the growth rates and growth contributions by sectors and industries have exhibited some structural changes.
1. Net Exports replaces Private Fixed Investment and returns to top one among economic growth contributions.
2. The annual growth rates of both Industry and Service industry have slowed down; the slowdown in Industry sector is relatively severer than that in the Service sector.
3. The contribution rate of Private Consumption toward economic growth has turned positive again, and the difference in the contribution rate of Industry sector over Service sector has also shown narrowing.
Look at the global geo-political and economic situations, it shows that the Russo-Ukrainian War started since February 24 this year has kept over 100 days, and it’s still ongoing; the international economic and financial sanctions against Russia imposed by the United States, Canada, the European Union, Japan, and Australia majorly has only grown; in addition, China, the largest world factory, has been adopting a net-zero quarantine policy for the Omicron-subvariant pandemic, which has exacerbated the global supply chain snare; bulk raw materials such as crude oil and grain are in short supply and their prices continue to soar. A global “Shortage Economy” is taking shape. The uncertainty risks of future “stagflation” and even recession are also increasing day by day. However, the rate of confirmed Covid-19 cases has decreased in some Asian countries, such as South Korea, Vietnam, the Philippines, etc., or that the governments have relaxed quarantine restrictions (e.g., Shanghai has ended its two-month lockdown), and the “Covid-19 Recovery Index” has improved.
Domestically, despite that the current CPI shows a significant lower uptrend than that of other industrial countries. IMF even predicts that Taiwan’s economic growth rate, especially per capita national income, will overtake South Korea in near coming years. However, the Directorate-General of Budget, Accounting and Statistics, Executive Yuan and some major macroeconomic forecasting institutes have also downgraded their predictions for Taiwan economic growth in 2022. (The Directorate-General of Budget, Accounting and Statistics, Executive Yuan has revised the latest forecast of 2022 Taiwan economic growth on May 27 this year to 3.91% from the original 4.42%. In addition, Taiwan Central Bank has also revised the economic growth rate released in March to 4.05% from the previous 3.6~3.8% released on May 12). The commercial service industry, which has been severely affected by the pandemic in the past two years, has again been affected by the Omicron subvariant recently. This time, the government has changed to adopt the “coexist with the virus” epidemic prevention policy. People start to “self-quarantine” too. With a huge number of mild symptom cases, the Nikkei Covid-19 Recovery Index has shown Taiwan's ranking down to 113rd place in the world.
Here, we would like to again recommend that the government and the private sector should cooperate to make full use of the existing advantages of the so-called “Chip Economy” of Taiwan, try to accelerate the adoption of various kinds of “import substitution” policies for the economy, together with the combination of “digital transformation” and “ESG sustainable transformation”, so as to stimulate the market-oriented “service-based transformation” for various industries. By saving the energy and improving its efficiency to enhance the value-added effect of digital innovations. Also, it can revitalize the domestic market, promote productivity and international competitiveness of the service sector, and reduce the overdependence on specific foreign markets so as to pursue sustainable economic development for Taiwan.
1. Comprehensive analysis and prediction
CDRI finds that the Coincidental Cyclical Composite Index for Service Industry (CCCIS) has peaked in August 2019 and continued to decline until August 2021 in the past.
The CCCIS continues to rise after trough in August last year and rises to 0.1174 Standard Deviation in April this year. It’s predicted to continue rising to 0.5947 Standard Deviation in October as well. (See Figure 1 and the appendix below)
Figure 1. “Tendencies and Forecasts of the Coincidental Cyclical Composite Index for the Service Industry”
Source: Business Cycle Forecasting Team, CDRI
The economic recovery in 2021 showed a big discrepancy amongst different sectors and industries. In Q1 2022, the macroeconomic growth gets slower, meanwhile, the divergences of recoveries among different sectors also get narrow down.
The recurrence of the pandemic last year (2021) has further damaged those who had suffered in 2020. However, the overall economic growth rate of 2021 is still high at 6.57% (after being revised by the Directorate-General of Budget, Accounting and Statistics, Executive Yuan at the end of May this year), mainly thriving from the manufacturing industry, with the growth contribution rate reaches 4.97%, while the growth contribution rate of service industry is only 1.89%. By sectors, Private Fixed Investment contribution rate reaches 3.92%, Net Exports accounts for 1.85%, while Private Consumption is -0.15%.
The Directorate General of Budget, Accounting and Statistics, Executive Yuan announces that the annual GDP growth rate in Q1 this year is 3.14%, and the momentum for the Private Investment is keeping strong, with a high annual growth rate of 6.64%, and its growth contribution rate reaches 1.45%. While the Net Exports grows by 10.95%, which has returned to top one record among the growth contributions of all sectors, 1.54%; and the Private Consumption is only 0.46%, and its growth contribution rate is 0.18%. (See Table 1)
In terms of industries, the Industry grows by 6.02% annually, with a contribution rate of 2.22%; the Service Industry grows by 1.61%, with a contribution rate of 1.06% (See Table 2 below). The economic growth rates of both the Industry and Service industries have slowed down in Q1 this year compared to last year. The slowdown in the Industrial sector was relatively severer than that in the Service industry. The growth contribution gap between the two industries also has narrowed as the overall economic growth rate gets slow down.
Table 1. The economic growth rate, and growth contribution rate of each sector in Q1 2022
Unit: Millions of New Taiwan Dollars; %
Source: The Directorate-General of Budget, Accounting and Statistics, Executive Yuan, and the Business Cycle Forecasting Team of CDRI
Table 2. The economic growth rate and growth contribution rate of each industry in Q1 2022
Unit: Millions
A cross-examination of sectors and industries reveals that under the impacts of the pandemic, private enterprises have been prospering in Investment, Manufacturing, and Exports, while domestic demand for private products and service consumption is still relatively sluggish, resulting in continually serious imbalances.
2. The outlook of business cycle for service industry
The compilation of the Composite Index system of the business cycle is based on the research of the Time Series Analysis. We analyze the relevant economic indicators in time series and screen out those with the significance of the business cycle and the stability of their cyclicality. It is classified into leading indicators, coincident indicators and lagged indicators by statistical analysis and verification. It has proved that the cyclical trend of the Composite Index of coincident indicators is highly correlated with the cyclical trend of GDP, and the forecast value of the Composite Index of the coincident indicators, estimated by the Leading Indicator Composite Index, could be used to forecast the moving trends of GDP.
The cyclical trend of economic indicators fluctuates around the long-term trend. The long-term trend value is set as 100, and the cyclical trend value is greater than 100 in the recovery or prosperity stage; and below 100 in the recession or depression stage.
The standardized changes of indicators’ cyclical trend values (in Standard Deviation unit) are added up to become a Composite Index, and it fluctuates around the long-term trend value with a Standard Deviation of 0.
The Leading and Coincidental Composite Indices Curve of this business cycle indicator system is shown in Figure 2.
Leading Cyclical Composite Index (LCCIS) has continued to decline since its peak in June 2018 and bottomed out in June 2020. After falling for two consecutive years, it has bottomed out, and has risen for 22 months till April this year (2022). Meanwhile, its indices changed from -0.6888 Standard Deviation in June 2020 to 0.0132 Standard Deviation in May 2021 and further reached to 0.7711 Standard Deviation in April this year.
Looking at the diffusion situations of the leading indicators, it shows that there are 4 out of 7 sub-indicators that are falling (two more compared to the last quarter). The most obvious is that the cyclical trend of the Stock Price Index of the commercial service industry and the Formation of Private Real Fixed Capital has turned downward. It shows that the risk of weakening strength has begun to lurk in an uptrend.
The CCCIS has ever started to fall from its peak in August 2018, with 0.4195 Standard Deviation, and then directly affected by the pandemic, has further fallen from 0.3496 Standard Deviation in July 2020 to become -0.4758 Standard Deviation in August 2021. After the decline for two years, it has bottomed out to 0.0259 Standard Deviation in March this year. Without the ongoing tendency change itself, it is predicted to be able to rise to 0.5947 Standard Deviation by October this year (See Figure 1 above and the appendix attached below).
Looking at the diffusion situations of the coincident indicators, same as to the last quarter, there are still 3 out of 5 sub-indicators keep declining.
Figure 2. The trends of Leading and Coincidental Cyclical Composite Index for the Service Industry
Source: Business Cycle Forecasting Team, CDRI
A. Leading indicator series
a. The business cycle trend of real GDP of the Transportation and Storage Industry has reached trough, but the production capacity hasn’t recovered yet.
The cyclical tendency value of this sub-indicator reached bottom, 95.88, in October 2020, and then rose to 100.18 (the estimated value) in October last year, further up to 104.55 in April this year (2022) by extrapolation. Obviously, the uptrend has accelerated in H2 2021, as the cyclical tendency value has exceeded the long-term trend level (100). However, the annual growth rate (YOY), calculated based on its actual value, has still been in negative growth in each quarter since 2020, only once a positive 4.74% turned in Q2 last year (2021). It decreased 13.25% in Q3 and slowed down in Q4. The estimated growth rate was revised to -1.55% from -1.46%. It has declined by 3.18% in Q1 this year, indicating that although the growth rate kept falling, but its falling speed has already slowed down.
Figure 3. The annual growth rate of Transportation and Storage GDP and the trend of business cycle, 2020Q1~2022Q1
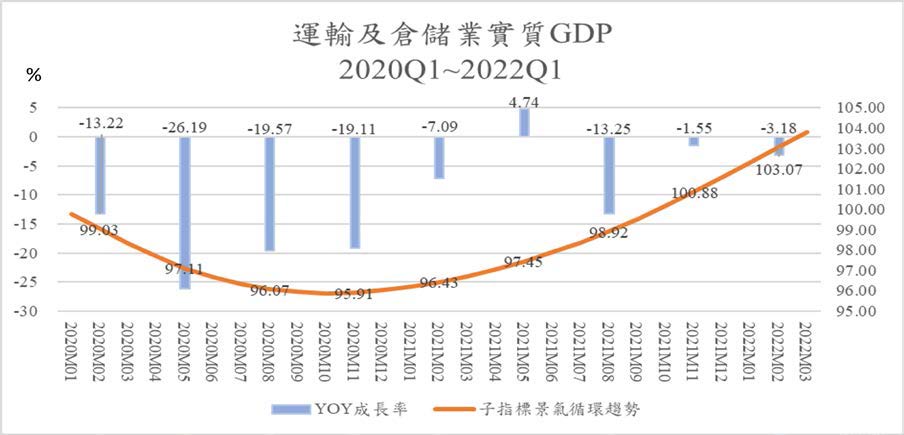
Source: Business Cycle Forecasting Team, CDRI and Directorate General of Budget, Accounting and Statistics, Executive Yuan
b. The Private Real Fixed Capital Formation has turned weak, Net Exports has regained its top one place of economic growth contribution rate.
The cyclical tendency value of this sub-indicator reached its lowest point, 98.67, in July 2020, and then exceeded the long-term trend value of 100 in February last year. It reached its peak, 101.5, in October last year. Then it has suffered a little downward to 101.05 (the extrapolated value) in April of this year, showing that it had ever surpassed the stagnation period, and had kept on strongly recovering for such a long time only till the Q3 2021. In Q1 this year, the trend of this indicator's business cycle has reversed downward a little more obviously.
The annual growth rate (YOY), calculated based on its actual value, has been in positive growth in each quarter since 2020. Especially, the four quarters of 2021 have increased respectively by 13.59%, 18.9%, 26.15% and 20.82% (preliminary estimated 17.27%). But the growth rate fell sharply to 6.64% in Q1 this year.
Figure 4. Annual growth rate and cyclical trend of Private Real Fixed Capital formation, 2020Q1~2022Q1
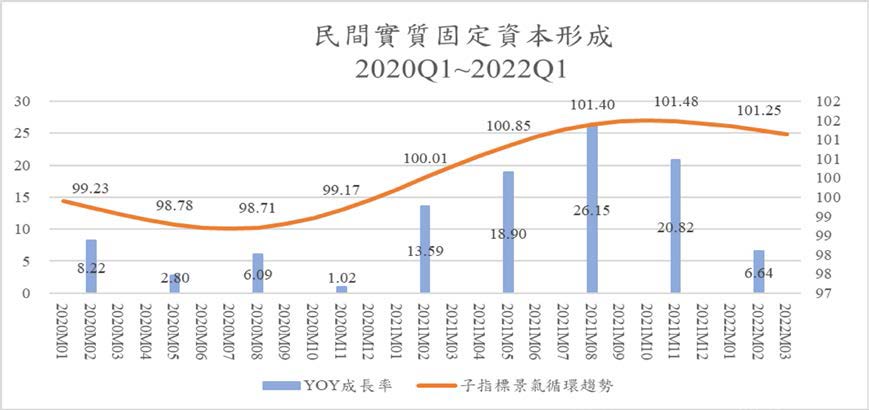
Source: Business Cycle Forecasting Team, CDRI and Directorate General of Budget, Accounting and Statistics, Executive Yuan
c. Net trade balance in Services Revenue and Expenditure shows the cyclical tendency value has exceeded its long-term trend value for such a long time, however, the cyclical trend has become to slow down after surpassing the long-term trend value.
The cyclical tendency of this sub-indicator reached the lowest, 95.36, in September 2019, and then rose all the way, reaching the long-term trend level in August 2020, with an index of 100.31. It reached the peak in May 2021 with an index of 102.1, and slightly turned down to 100.43 in April 2022 (extrapolated).
The service trade of Taiwan, which had suffered a long-term deficit, had a great improvement of the net services trade balance since the global pandemic blocked the mobility of international tourism in 2020, and then turned into a surprising trade surplus in Q2 2020. The net trade balance in Services Revenue and Expenditure in Q1 last year reached its historical high, with a 647.85% growth rate (YOY). It dropped to 153.39% in Q2 and 89.61% in Q3 (revised) and rebounded to 150.75% in Q4 (revised). However, its increasing has dropped to 54.76% in Q1 this year. It shows that the improving path of the Services Revenue and Expenditure has slowed down since Q2 last year.
Figure 5. Annual growth rate and cyclical trend of net trade in Services Revenue and Expenditure, 2020Q1~2022Q1
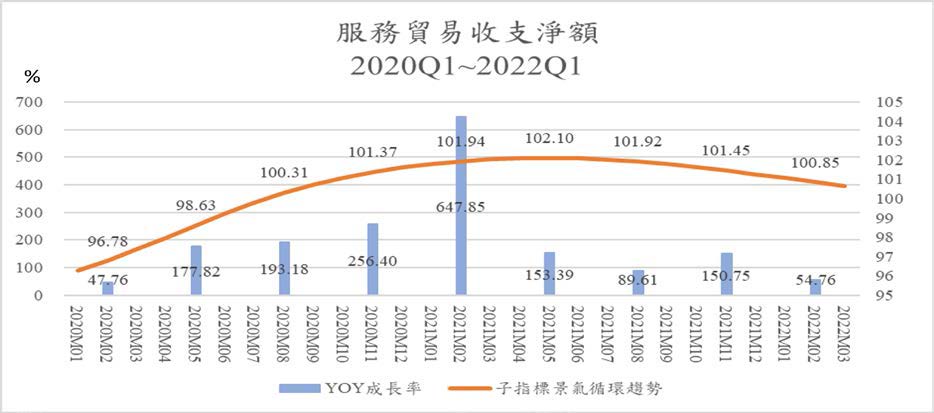
Source: Business Cycle Forecasting Team, CDRI and Directorate General of Budget, Accounting and Statistics, Executive Yuan
d. The Initial Acceptance of Unemployment Benefits (inverted) shows the unemployment pressure is alleviating.
The cyclical tendency of this sub-indicator reached its lowest, 90.96, in June 2020, and then rose all the way, exceeding the long-term trend value of 100 in July 2021, and reached 111.59 in April this year. It indicates that the employment demand rapidly increases due to the large amounts of investment from the return of Taiwanese businessmen and “TSMC EFFECT”. Therefore, the number of people applying for unemployment benefits for the first time, a leading indicator to the unemployment rate, has dropped significantly. This should basically be an indicator of the overall economy. But it is not necessary to be a phenomenon that may not occur in the service industry. While compared with the Net Entry Rate of Employees in commercial service industry below, which business cycle index exceeding the long-term trend value in July last year, it shows that the leading indicators of employment in the service industry has indeed been improving significantly.
Figure 6. Number of the initial acceptance of unemployment benefits (inverted) and the annual growth rate and cyclical trend January 2020 to April 2022
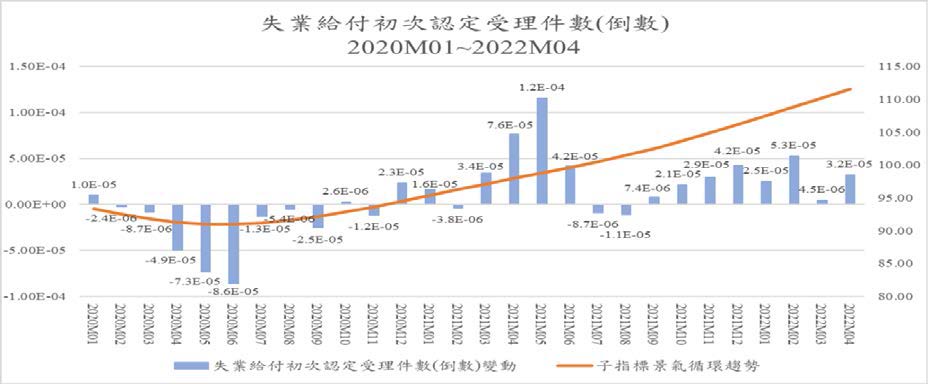
Source: Business Cycle Forecasting Team, CDRI and Directorate General of Budget, Accounting and Statistics, Executive Yuan
e. The Net Entry Rate of Employees in the commercial services industry-the business cycle trend that crosses the long-term trend value will lead to employment improvement.
The cyclical tendency of this sub-indicator reached its peak, 100.38, and fluctuated around the long-term trend value of 100. It started to be below the long-term trend level in March 2020, and reached its trough with 98.84 in February 2021, and then rebounded all the way, reaching 102.32 in April this year. It shows that employment demand in the service industry has once been severely impacted by the pandemic in 2020, which is contrary to the boom in the manufacturing industry. Meanwhile, the changes in the actual value of this indicator during this period also showed a downward trend. When the leading indicator has rebounded, the coincident indicator of “total employment” and the lagged “unemployment rate” would improve after a certain period of time as well.
Figure 7. Annual changes and cyclical trends in the net entry rate of employees in the commercial service industry, January 2020 to March 2022
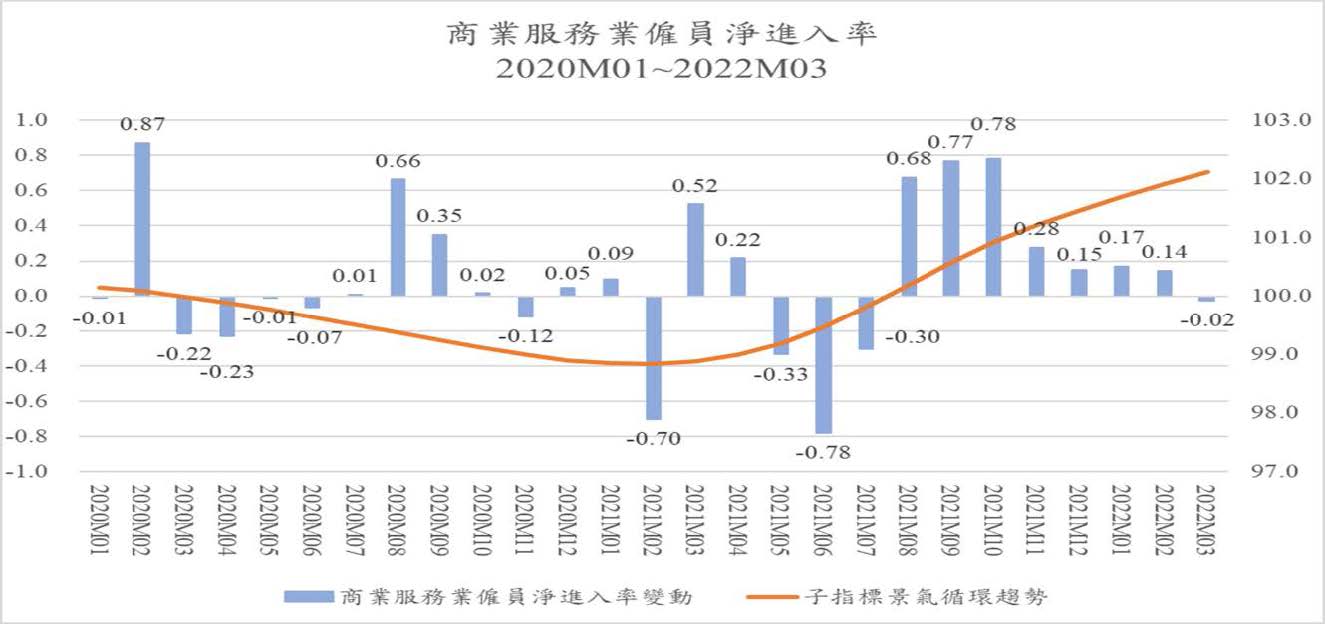
Source: Business Cycle Forecasting Team, CDRI and Directorate General of Budget, Accounting and Statistics, Executive Yuan
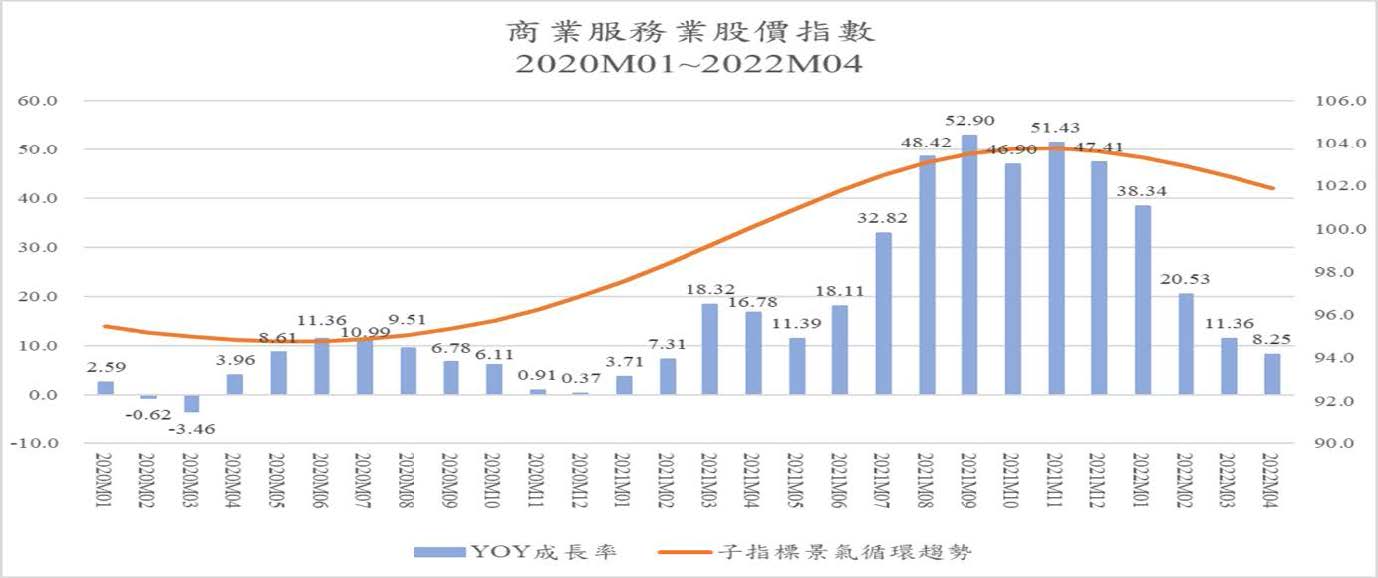
f. The Stock Price Index of the commercial services sector.
The cyclical tendency of this sub-indicator reached the lowest, 94.76, in May 2020, and then kept rising all the way, exceeding the long-term trend level in April last year, and reached its peak with an index of 103.77 by November last year. This reflects the prosperity of Taiwan’s general stock market in the past year and a half. However, it began to decline in December last year, and the cyclical tendency value has returned to 101.87 in April this year, and the pace has accelerated.
Take a look at the annual growth rate of the actual Stock Price Index. It has seen double-digit growth since March last year and even reached 32.82% and 48.42% in July and August, respectively. In September and October, the growth rate came to 52.9% and 46.9%, and another 51.43% and 47.41% in November and December. But then it has seen four consecutive months of rapid slowdown, 38.34%, 20.53%, 11.36%, and 8.25% respectively.
Figure 8. The annual growth rate and circular trend of the Stock Price Index of the commercial service industry, January 2020 to April 2022
Source: Business Cycle Forecasting Team, CDRI and Directorate General of Budget, Accounting and Statistics, Executive Yuan
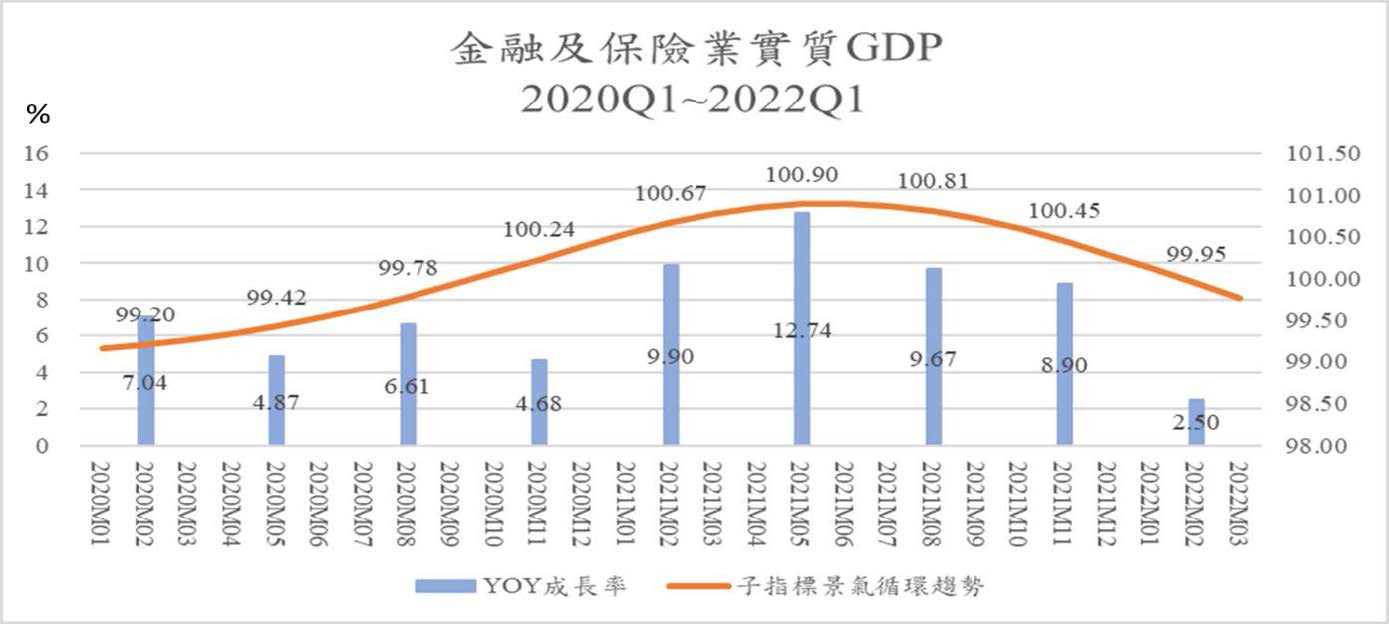
g. The cyclical trend of Real GDP of Finance and Insurance Sector- turned from a slight recovery to a decline.
The cyclical tendency of this sub-indicator has bottomed out in June 2019, with an index of 98.98, and began to exceed the long-term trend value (100) at 100.08 in October 2020, and continued to rise slightly, reaching the peak with 100.9 in June 2021, and then slightly decreased. It reached 99.59 (the extrapolated value) by April this year, back to its level in June 2020.
The annual growth rate (YOY), calculated based on its actual value, has been in positive
growth since last year. The growth rate in each quarter last year were: 9.9%, 12.74%, 9.67% (revised) and 8.9% (revised). However, it dropped 2.5% in Q1 this year. The positive annual growth rate of its GDP is consistent with its upward cyclical trend. However, the relatively low cyclical trend value unparalleled to the high growth rate of actual value of GDP seems to imply that the long-term trend of this indicator is considerably steep, that is, its structural change is significant. However, its cyclical trend has turned to begin to slow down in this year.
Figure 9. Annual growth rate and cyclical trend of real GDP of Finance and Insurance Sector, 2020Q1~2022Q1
Source: Business Cycle Forecasting Team, CDRI and Directorate General of Budget, Accounting and Statistics, Executive Yuan
B. Coincident indicator series
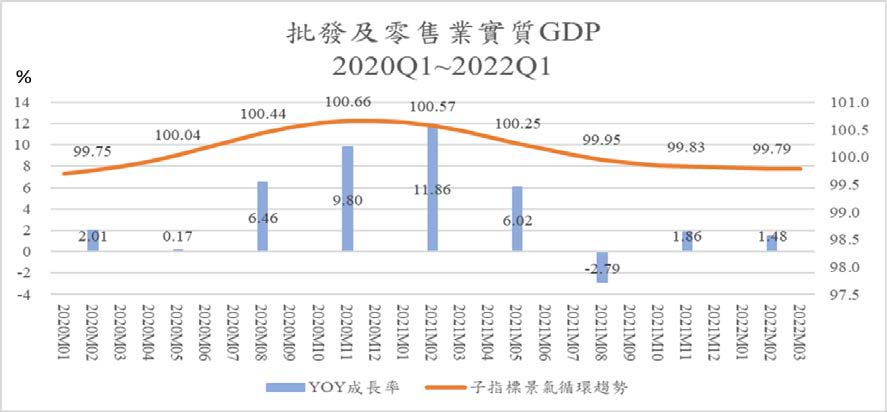
a. The business cycle trend of real GDP Index of Wholesale and Retail-slightly downwards.
This cyclical tendency of this sub-indicator reached its bottom in November 2019, with an index of 99.67. After a year of slow recovery, it reached 100.66 in December 2020. Then it fell all the way down. It was lower than the long-term trend value (100) in August last year and dropped to 99.77 (the extrapolated value) in April this year. It shows that although there are no significant fluctuations alongside the long-term trend value yet, there has been a relatively obvious decline since Q2 last year (2021), but the decline has been minimal since Q3.
Meanwhile, the actual annual growth has shown a recorded high double-digit growth in Q1 2021, and then slowed down. While Q3 last year saw a negative growth of 2.79% for the first time and slightly returned to a positive growth of 1.86% in Q4. It then dropped to 1.48% in Q1 this year again.
Figure 10. Annual growth rate and cyclical trend of real GDP Index of Wholesale and Retail, 2020Q1~2022Q1
Source: Business Cycle Forecasting Team, CDRI and Directorate General of Budget, Accounting and Statistics, Executive Yuan
b. Real GDP of the Accommodation and Catering Industry-declined since the beginning of last year, slightly recovered in Q4.
The industry has been greatly impacted by the pandemic. The cyclical tendency of this sub-indicator peaked in May 2019 with an index of 102.98, and then fell all the way. It was lower than the long-term value in April 2020 and reach its trough with 97.2 in May last year. The cyclical tendency value returned to 100.1 in November last year and reached 104.49 in April this year. However, the real GDP has always been a negative growth rate, which shows that the long-term trend of the representative structure has deteriorated.
Take a look at the annual growth rate of real value, it has always been negative since 2020. Except for the growth rate of 8.43% in Q1 (2021) and 1.62% (revised, preliminary estimated 1.83%) in Q4 last year, there were -11.01% in Q2, and -26.32% in Q3 and another -0.27% in Q1 this year.
Figure 11. The annual growth rate and circular trend of real GDP in the Accommodation and Catering Industry, 2020Q1~2022Q1
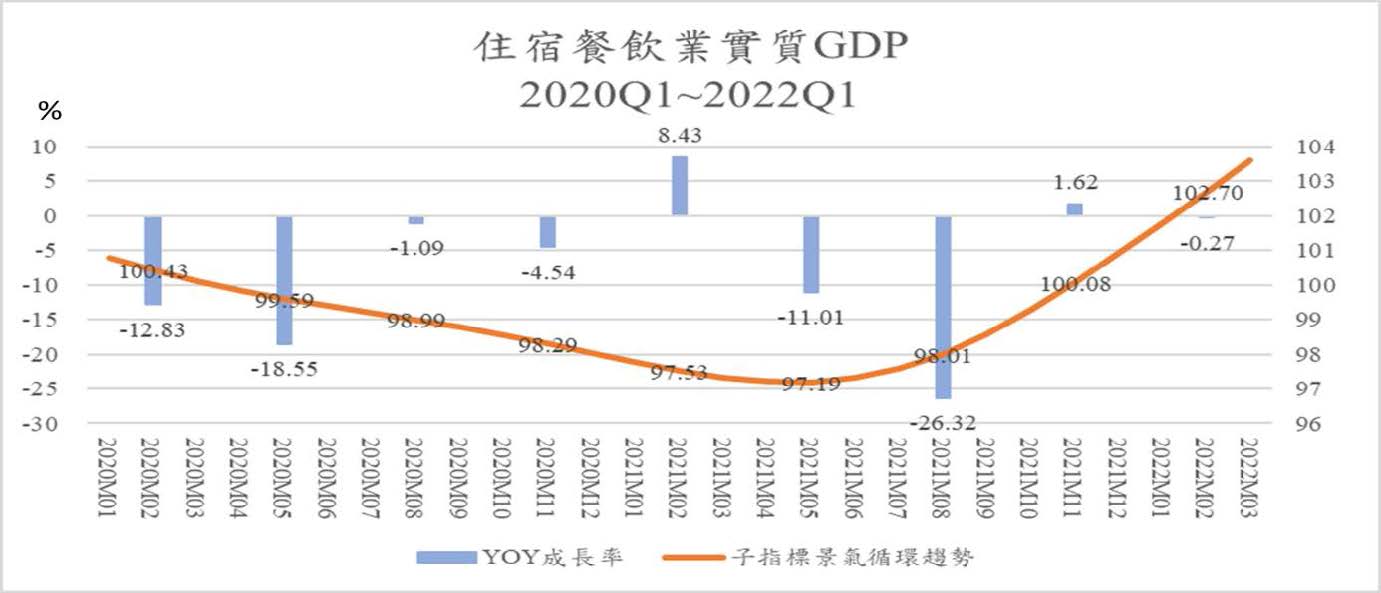
Source: Business Cycle Forecasting Team, CDRI and Directorate General of Budget, Accounting and Statistics, Executive Yuan
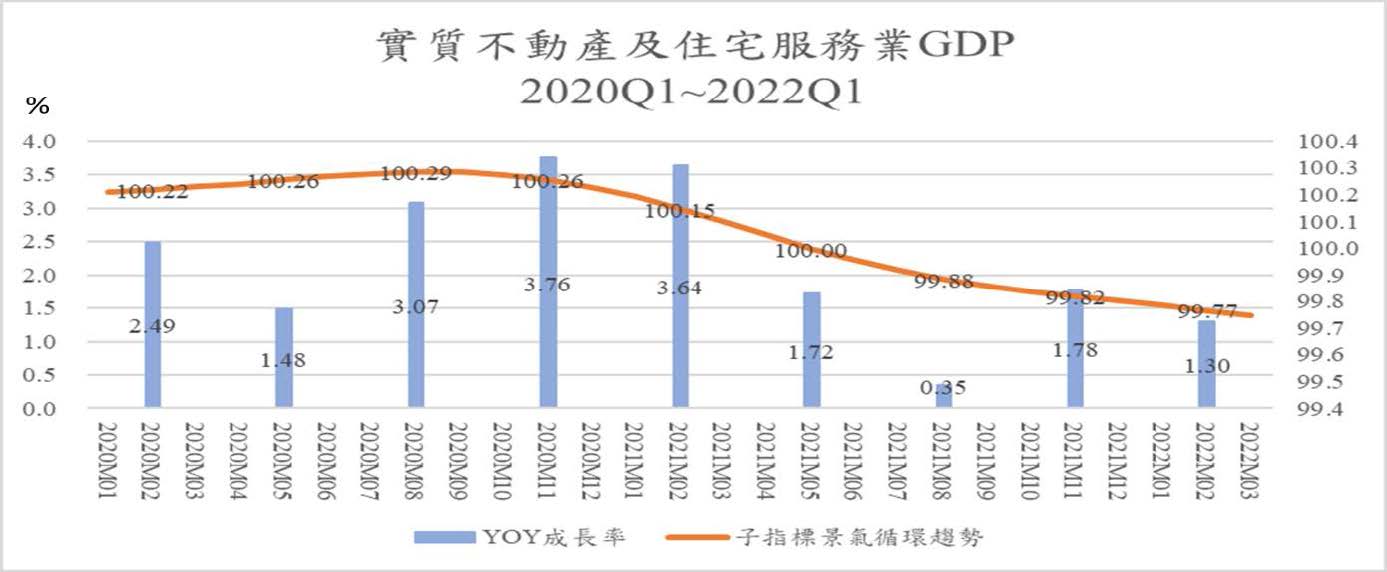
c. Real GDP of Real Estate and Residential Service Industry-business cycle trend
continued downward, and growth continued to be sluggish.
The cyclical tendency of this sub-indicator fluctuates slightly over a long period of time. The index peaked in August 2020, with an index of 100.28 and then showed a series of slight declines. It was lower than the long-term trend until May 2021 and continued to decline with 99.73 (the extrapolated value) in April this year.
The actual annual growth rate has shown a continuing positive growth in a row. However, it has slowed down through Q2-Q4 last year.
Although the industry is still growing, the growth rate in Q2 last year has become significantly weaker than before. It was slightly revised down to 1.78% in Q4 last year, and in Q1 this year, it was reduced to 1.3%.
Figure 12. Annual GDP growth rate and cyclical tendency of Real Estate and Residential Service Industry, 2020Q1~2022Q1
Source: Business Cycle Forecasting Team, CDRI and Directorate General of Budget, Accounting and Statistics, Executive Yuan
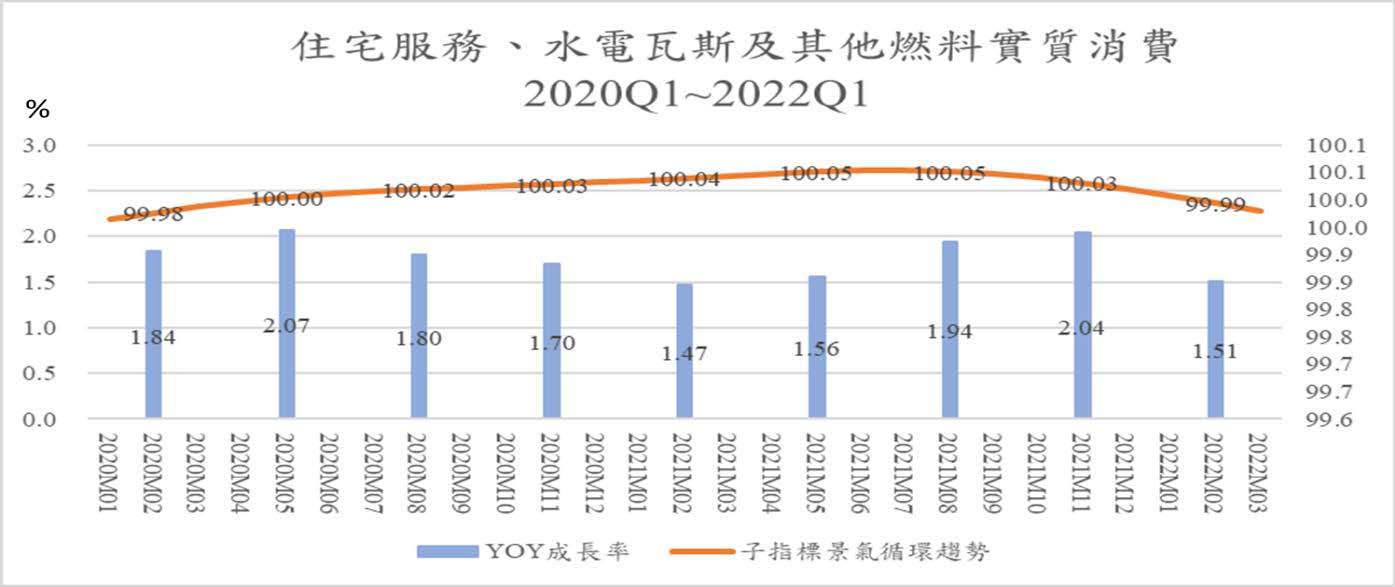
d. Residential Services, Utilities, and Other Fuel Industries-continues to grow slightly while the business cycle trend declines slightly.
The cyclical tendency of this sub-indicator has a little long-term fluctuation. It reached the bottom in March 2019, with an index of 99.88, and then kept rising slightly all the way, reaching its peak with 100.05 in July last year (2021), and then slightly declined. It reached 99.97 in April this year (extrapolated).
Meanwhile, the actual annual growth rate has seen a slightly positive growth since 2020. However, it was never higher than 2%. However, the number in Q4 was being revised to 2.04% and dropped to 1.51% in Q1 this year.
Figure 13. Real Consumption of Residential Services, Utilities, and Other Fuel Industries, 2020Q1~2022Q4
Source: Business Cycle Forecasting Team, CDRI and Directorate General of Budget, Accounting and Statistics, Executive Yuan
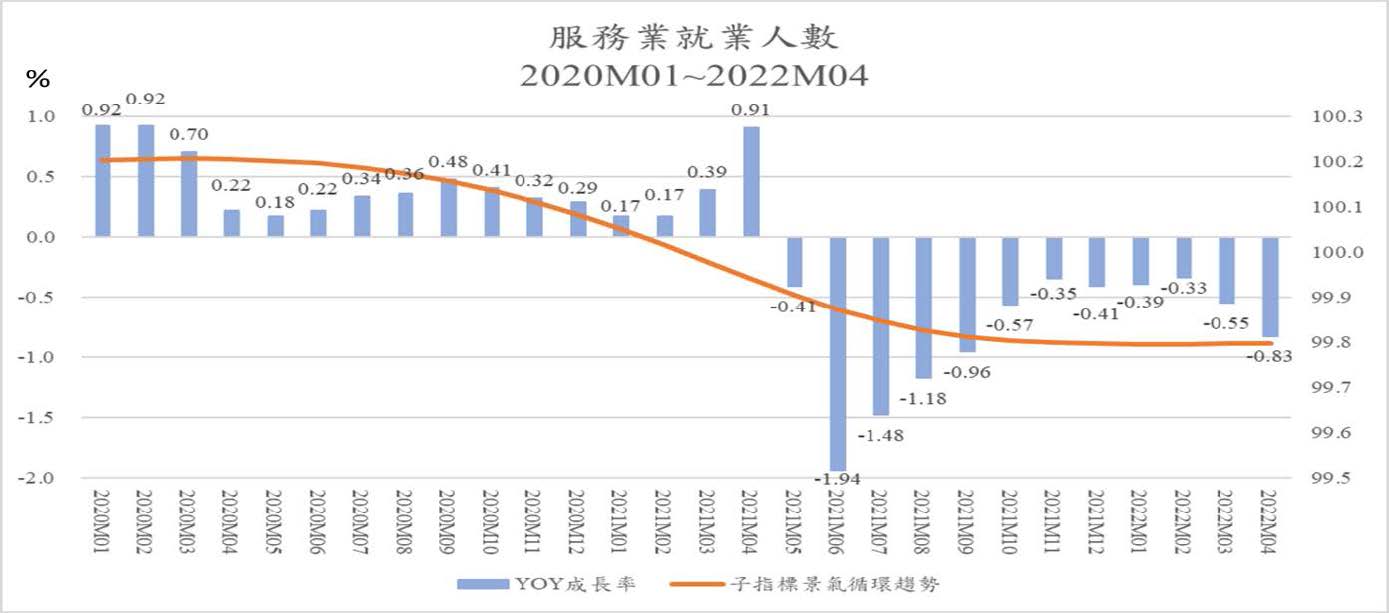
e. Number of employees in the service industry-affected by the downward trend but has slightly increased since January this year.
The cyclical tendency of this sub-indicator peaked in March 2020 with an index of 100.21, and then fell all the way to below the long-term tendency value as 99.98 in March 2021. It only showed a slight decrease, while the decline also slowed down gradually. However, the slowdown accelerated slightly from Q4 2020 to Q3 2021, bottomed out in January this year (2022), and then saw a slight recovery until March.
The actual annual growth rate has seen a limited positive growth from last year until this April. Even the growth rate peak never hit a high of 1%. It started to grow negatively from May 2021 to April 2022, especially in Q2 and Q3 last year. Obviously, it was affected by the recurrence of the pandemic, which has reduced demand for labor due to the recession.
Figure 14. The growth rate and cyclical tendency of The Number of Employees in the Service Industry, January 2020 to April 2022
Source: Business Cycle Forecasting Team, CDRI and Directorate General of Budget, Accounting and Statistics, Executive Yuan
C. Lagged indicator series
The lagged indicator includes Real Consumption of Tobacco and Alcohol, Real Consumption of Clothing, Footwear, and Apparel, Real Consumption of Furniture, Equipment, and Housekeeping, and The Number of Initial Recognition and Acceptance of Unemployment Benefits. The Lagged Index can be used as a reference for observing whether a business cycle is over. This article omits relevant analysis.
Appendix
Business Cycle Coincident Composite Index for Taiwan Service Sector
