Authors: Tain-Tsair Hsu(許添財)Shin-Hsien Chen(陳世憲)
【Abstract】
In Q3 2022, the Coincidental Cyclical Composite Index for Service Industry (CCCIS) showed a slight rebound and didn’t continue to decline as predicted. The main reason is that the Accommodation and Catering Industry has rebounded strongly since Q2, and the number of employments in the Service Industry has also increased during the same period, which is a far cry from the consistent decline in the previous year.
However, the Leading Composite Index continued to decline, and the speed of the decline accelerated, resulting in the Coincidental Composite Index stop rising and turn downward in Q1 next year (2023) after a short-term oscillation. It means that the effect of the loosening of pandemic prevention measures as the pandemic slows down is limited by the downward trend of the overall economy, which means that the Commercial Service Industry dominated by Domestic Demand doesn’t have enough strength to reverse the trend. We can see that the gradual recovery of the Coincidental Composite Index in Q2 this year (2022) is still at best a fluctuating phenomenon at the bottom that can’t be regarded as a real recovery.
Looking at the global economic situation, since the outbreak of the COVID-19 pandemic in the past three years, factors affecting the downward trend of the economy such as the pandemic, extreme weather, geopolitical conflicts, the “Great Ebb” of globalization, and the Russia-Ukraine war have intensified. The supply chain is broken, energy and food shortages, and spiral price rises form trigger Fed to “shrink its balance sheet”, and then raise interest rates, causing the currencies of various countries to devalue. Inflationary pressures spread across the world, and demand for international trade weakened. At the same time, China, the second largest economy, was affected by the “Zero COVID” of pandemic prevention and the Real Estate Bubble Crisis. The US stock market finally lost ground and spread to the global stock market. IMF estimates and forecasts for world economic growth in 2022 and 2023 have undergone an unprecedented four downward revisions. The “unbalanced” recovery in 2021 failed to improve upwards but turned into a continuous downward trend. Those who have made progress, the inflationary pressure hasn’t been relieved, and now the situation has deteriorated into the most serious “stagflation” “uncertainty” crisis since the oil crisis.
Under such trend, during the pandemic, Taiwan has still been able to rely on the solid foundation of its semiconductor-based manufacturing industry (TSMC has even jumped to the world’s tenth largest market capitalization brand), and the pandemic prevention has been relative successful compared to the world, manufacturing and international trade haven’t experienced supply chain disruption, and the economic resilience is strong, dominating the world.
However, the international economic situation continues to deteriorate. Today, although the pandemic situation at home and abroad has slowed down, the borders of various countries have also reopened. After Taiwan opened its border on October 13, it also began to conditionally “unmask” from December 1. The Catering Industry is able to feel the signs of the changing environment in advance, and other Consumer Service Industries also gear up to look forward to the arrival of “revenge” consumption, but inflation has clearly eroded the purchasing power of the citizens. The pandemic has impacted manpower supply and demand, and employment structure, and changes in consumer behavior and consumption trends have also created a “new normal”.
Only innovative and adaptable new business models and strategies can effectively “bring in new life”, not only in the Catering, Tourism and Accommodation of the Commercial Service Industry, but also in other Financial and Logistics Transportation, and even in the international trade and Cross-Border E-commerce Service Industries. The well-known waves of “digital transformation”, “energy transformation” and “ESG sustainable transformation” are coming more fiercely, and they are waiting for the government, civil society, institutions, and experts to conspire solutions to accelerating change and innovation, and promote historical major investment trend driven by digital and services, reviving another wave of “innovative value” investment after the wave of “return of Taiwanese businessmen”, and completely transform it into a new industrial structure and economic system capable of ensuring “balanced” and “sustainable” development in the future.
1. Comprehensive analysis and prediction
CDRI finds that the Coincidental Cyclical Composite Index for Service Industry (CCCIS) has bottom out in May 2022 of -0.2828 Standard Deviation and predicts that CCCIS will reach its peak in January next year (2023) with -0.2376 Standard Deviation, and then started to decline, reaching -0.2411 Standard Deviation in April. It’s clear that this isn’t a real recover. (See Figure 1 and the appendix below)
Figure 1. “Tendencies and Forecasts of the Coincidental Cyclical Composite Index for the Service Industry”
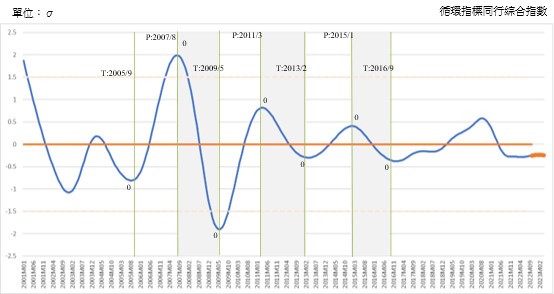
Source: Business Cycle Forecasting Team, CDRI
The economic growth in Q1-Q3 this year (2022) is significantly slower than that in 2021. The range of change is also inversely proportional to last year among different sectors and industries.
Based on the data provided by the Directorate General of Budget, Accounting and Statistics, Executive Yuan, the economic growth rate in Q1-Q3 has shrunk to 3.62%. Private Investment continued to be the top sector amongst the growth contributions of all sectors, but has dropped from double digits to single digits, with 1.8% left. Private Consumption, which had the weakest growth contribution rate in the past, has turned positive, and its growth rate contribution has also increased to 1.58%, second only to Private Investment. On the other hand, Net Exports have slowed significantly, with a growth rate of only 0.07% and the growth contribution of 0.01%. Due to the pessimistic economic outlook and rising costs, Inventory Investment has shrunk by as much as 64.86%, and the growth rate contribution has shown -0.56%. The momentum of economic growth has shifted from external demand to Domestic Demand. Exports have always been the engine of Taiwan’s economic growth, and the impact of weak international market demand on Taiwan’s economy can’t be underestimated. (See Table 2)
From the perspective of industry, the growth rate contribution in Q1-Q3 this year has also undergone major changes. The growth contribution of the service industry has become greater than that of the industry, 1.75% and 1.71% respectively.
Table 2. Q1 2022 economic growth rate and growth contribution rate, by sector
Unit: Millions of New Taiwan Dollars; %
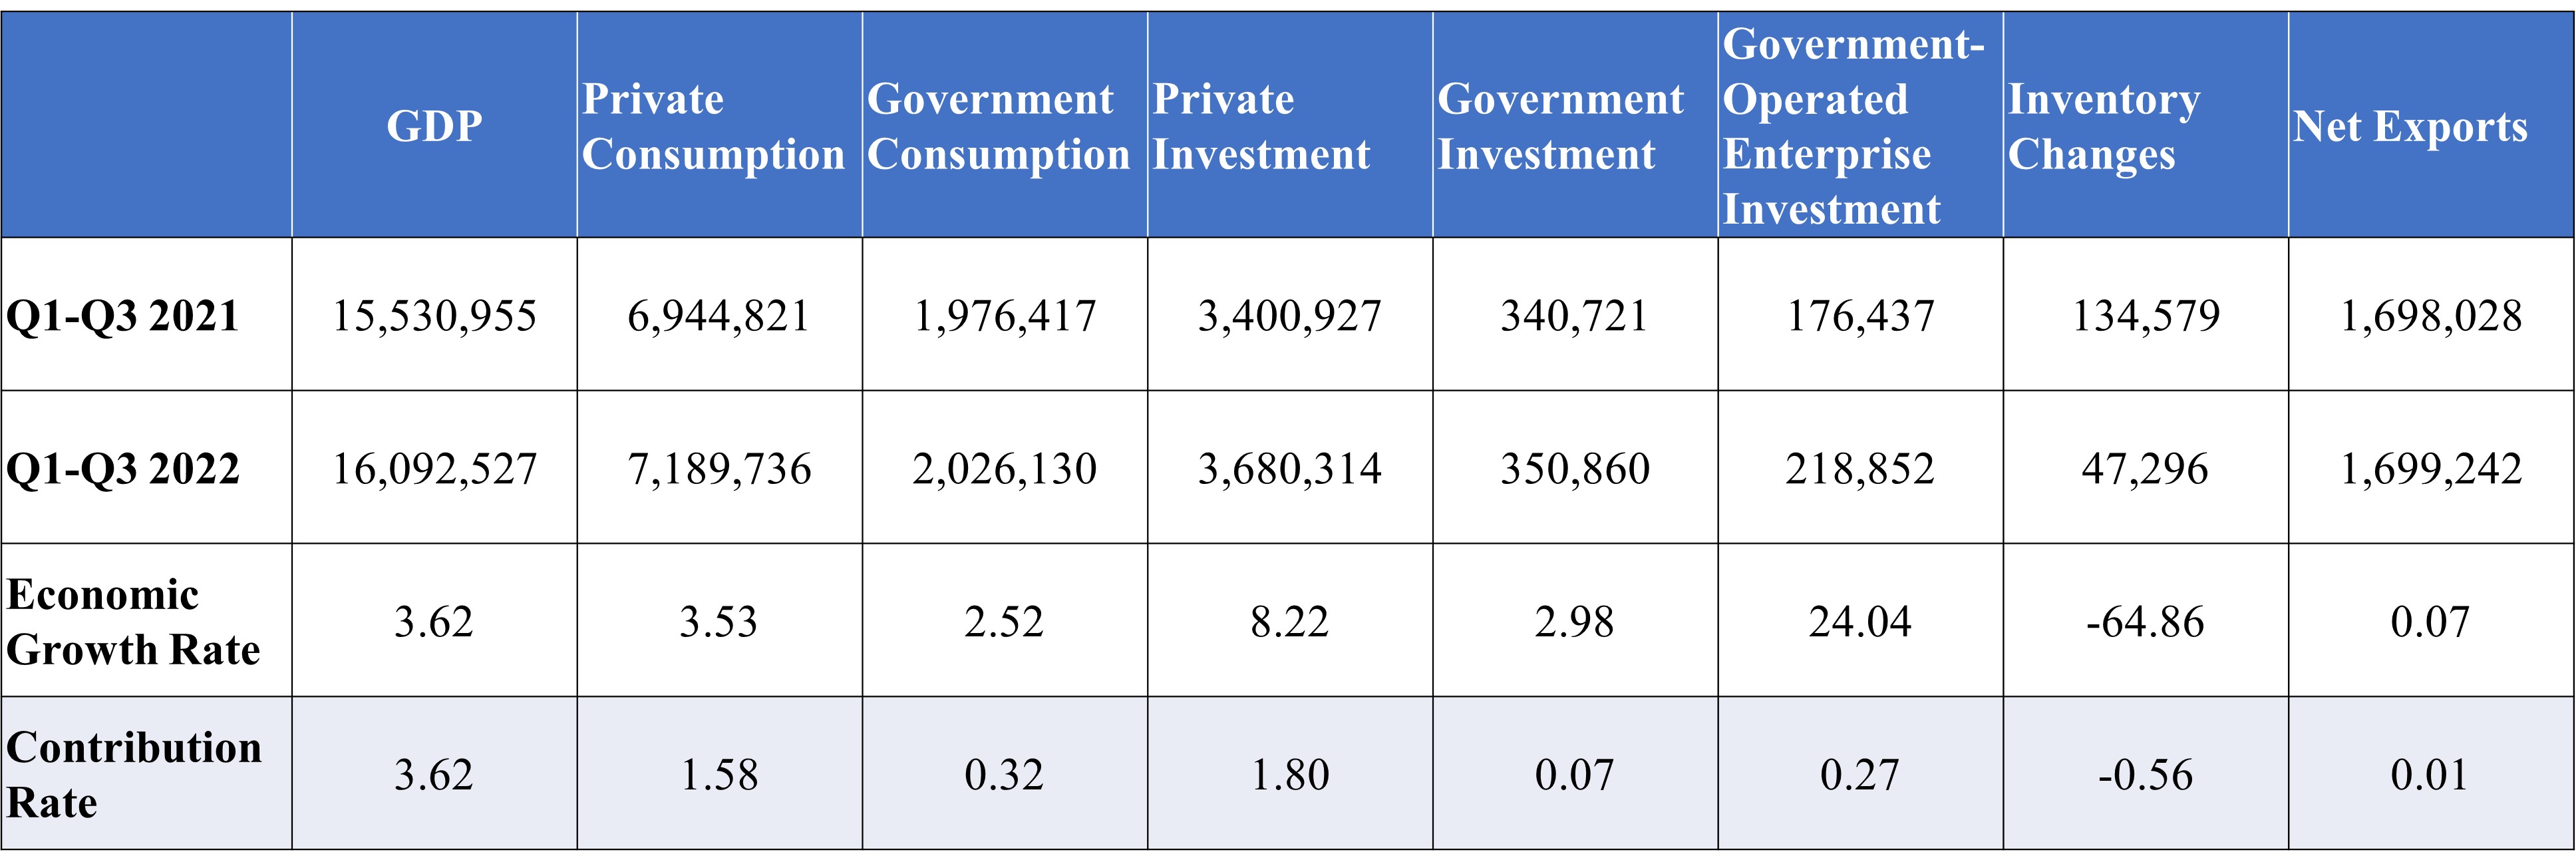
Source: Directorate-General of Budget, Accounting and Statistics, Executive Yuan, and the Business Cycle Forecasting Team of CDRI
Table 3. Q1 2022 economic growth rate and growth contribution rate, by industry
Unit: Millions
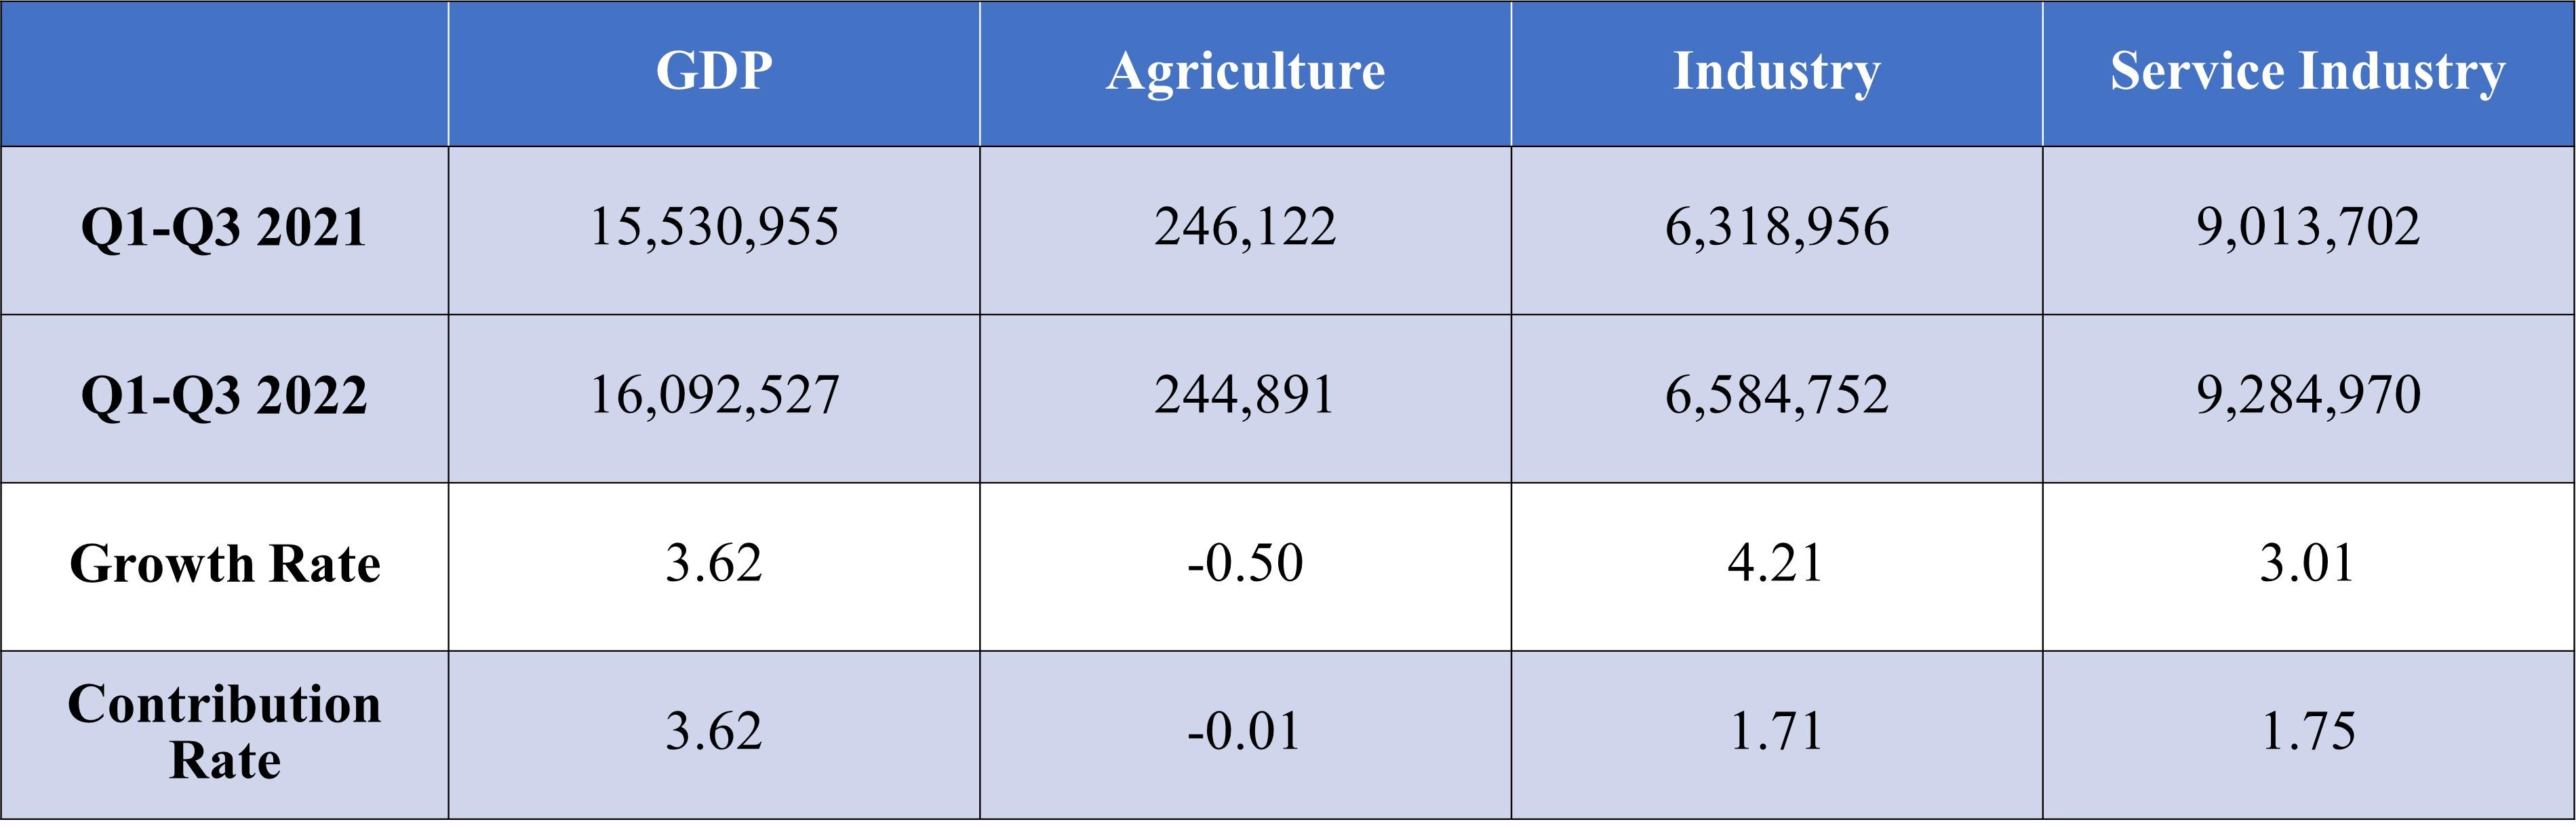
Source: Directorate-General of Budget, Accounting and Statistics, Executive Yuan, and the Business Cycle Forecasting Team of CDRI
2. Service industry business cycle outlook
【Regarding the indicator system】
The business cycle Composite Index system on the Time Series Analysis. We analyze the relevant economic indicators in the time series and select indicators based on their significance to the business cycle and stability of their cyclicality. They are then classified into leading indicators, coincident indicators and lagged indicators through the use of statistical analysis and verification.
The cyclical trend of the Composite Index of coincident indicators is shown to be highly correlated with the cyclical trend of the GDP, and the forecast value of the Composite Index of the coincident indicators, estimated by the Leading Indicator Composite Index, could be used to forecast the moving trends of the GDP.
The cyclical trend of economic indicators fluctuates around the long-term trend. The long-term trend value is normalized to 100; cyclical trend values greater than 100 indicate a recovery or prosperity stage while values below 100 indicate a recession or depression stage.
The standardized changes of the indicators’ cyclical trend values (in Standard Deviation units) are added up to become a Composite Index, and it fluctuates around the long-term trend value with a Standard Deviation of zero.
【Latest Indicator Trends】
The Leading and Coincidental Composite Indices Curve for this business cycle’s indicator system is shown in Figure 2.
Leading Cyclical Composite Index (LCCIS) has bottom out in May 2020 and has risen for 18 months until November of this year (2022). The Leading Composite Index Then dropped from its peak, from the high of 0.5784 Standard Deviations in November last year to -0.4838 Standard Deviations in October (2022).
Looking at the diffusion situations of the leading indicators, only 2 of the 7 sub-indicators are currently on the rise.
The CCCIS has been directly affected by the pandemic, having fallen from its peak of 0.5785 Standard Deviations, in August 2020 to -0.2828 Standard Deviation in May 2022. It then started to rise to -0.2495 Standard Deviation in October this year. It is expected to reach its peak and decline in January next year, and dropped to -0.2411 Standard Deviation by April 2023 (See Figure 1 above and the attached appendix).
Looking at the diffusion situations of the coincident indicators, 3 out of the 5 sub-indicators keep declining.
Figure 2. Leading and Coincidental Cyclical Composite Index for the Service Industry
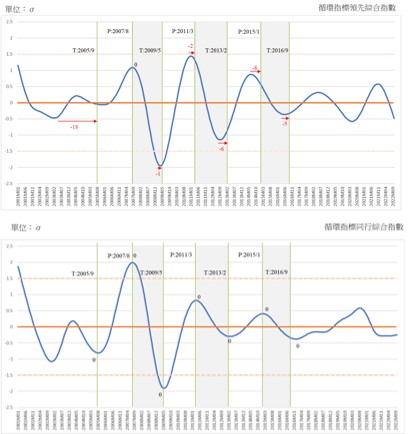
Source: Business Cycle Forecasting Team, CDRI
A. Leading indicator series
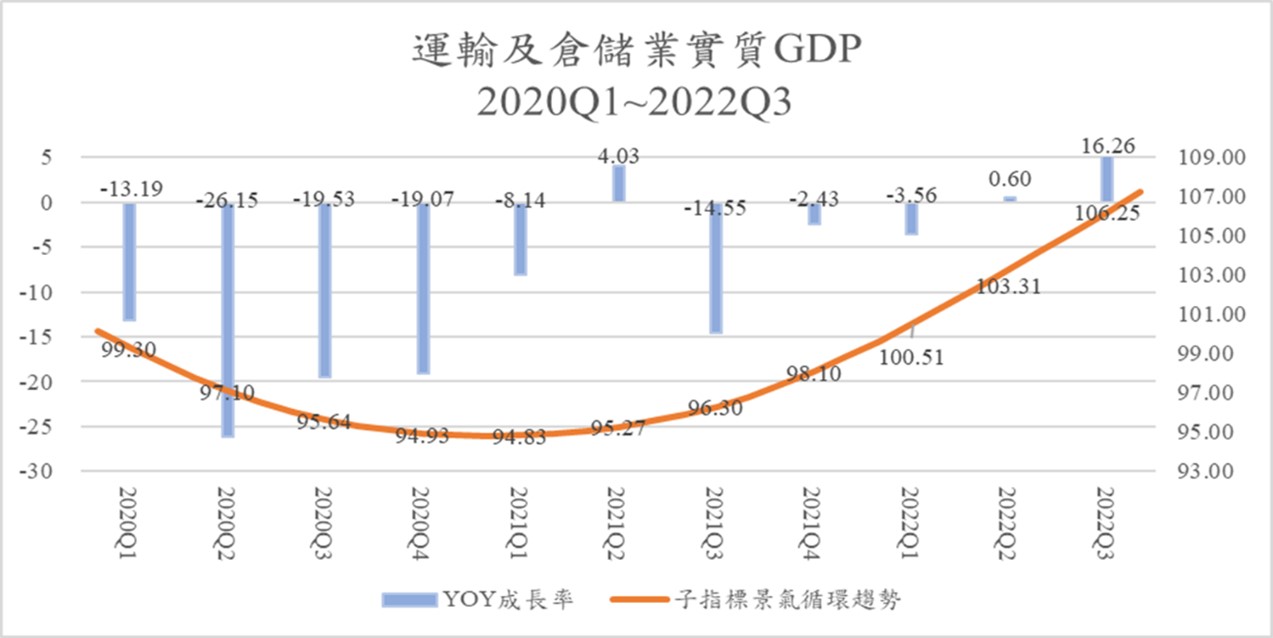
a. Business cycle trend of real GDP of the Transportation and Storage Industry has slightly recovered, being top of the GDP growth momentum.
The cyclical tendency value of this sub-indicator reached a low of 94.8 in January 2021, and then rose to 107.23 in September this year, 108.21 in October (extrapolated). It’s clear that the value has been accelerating since H2 last year, and then exceeded the long-term trend value of 100 in February this year.
However, the annual growth rate (YOY), calculated based on its actual value, has still been in negative growth in each quarter since 2020, only once being positive at 4.03% during Q2 last year (2021). It decreased 14.55% in Q3 and slowed down in Q4. It then rose to 0.6% in Q2, with a substantial growth of 16.26% in Q3.
Figure 3. The annual growth rate of Transportation and Storage GDP and business cycle trend, 2020Q1~2022Q3
Source: Business Cycle Forecasting Team, CDRI and Directorate General of Budget, Accounting and Statistics, Executive Yuan
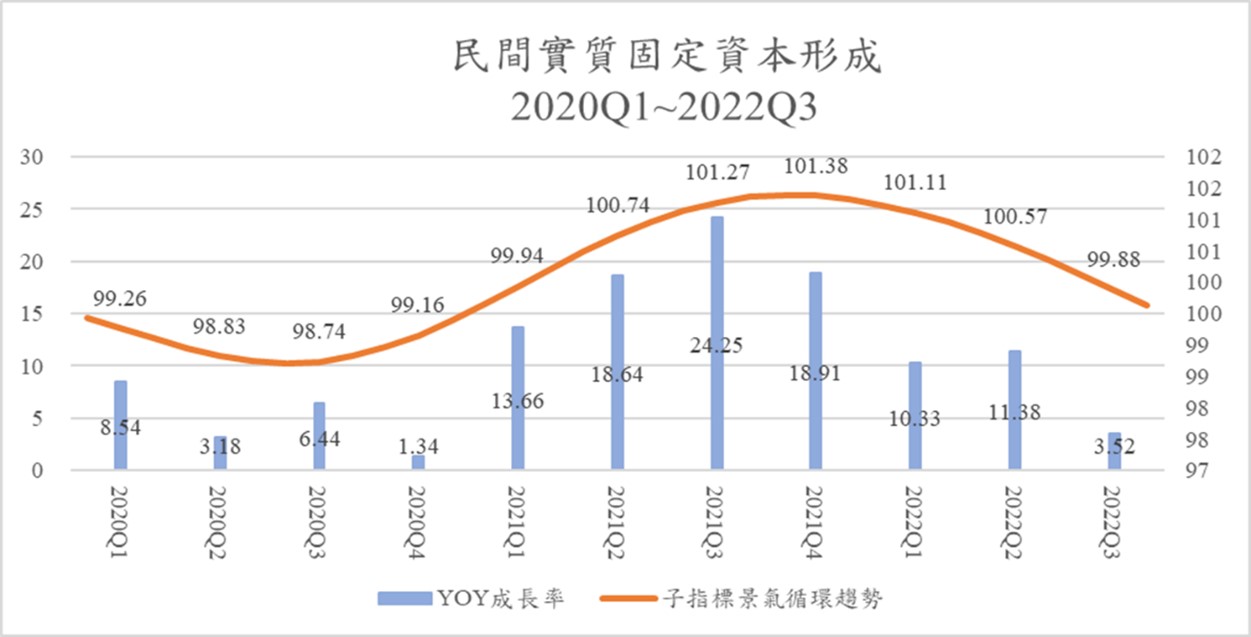
b. Private Real Fixed Capital Formation has weakened
The cyclical tendency value of this sub-indicator reached its lowest point of 98.71, in July 2020, and then exceeded the long-term trend value of 100 in March last year. It then reached its peak, 101.39, in October last year and started to slightly accelerate. The index in August this year (2022) is already below the long-term trend value, and it is extrapolated to 99.4 in October, which shows that the Private Investment boom driven by the return of Taiwanese businessmen is cooling down, and it is worth paying attention to.
The annual growth rate (YOY) has been in positive growth in each quarter since 2020. There was a double-digit annual growth rate from 2021 to Q2 this year, but it has dropped to 3.52% in Q3and the growth trend has slowed down significantly.
Figure 4. Annual growth rate and cyclical trend of Private Real Fixed Capital formation, 2020Q1~2022Q3
Source: Business Cycle Forecasting Team, CDRI and Directorate General of Budget, Accounting and Statistics, Executive Yuan
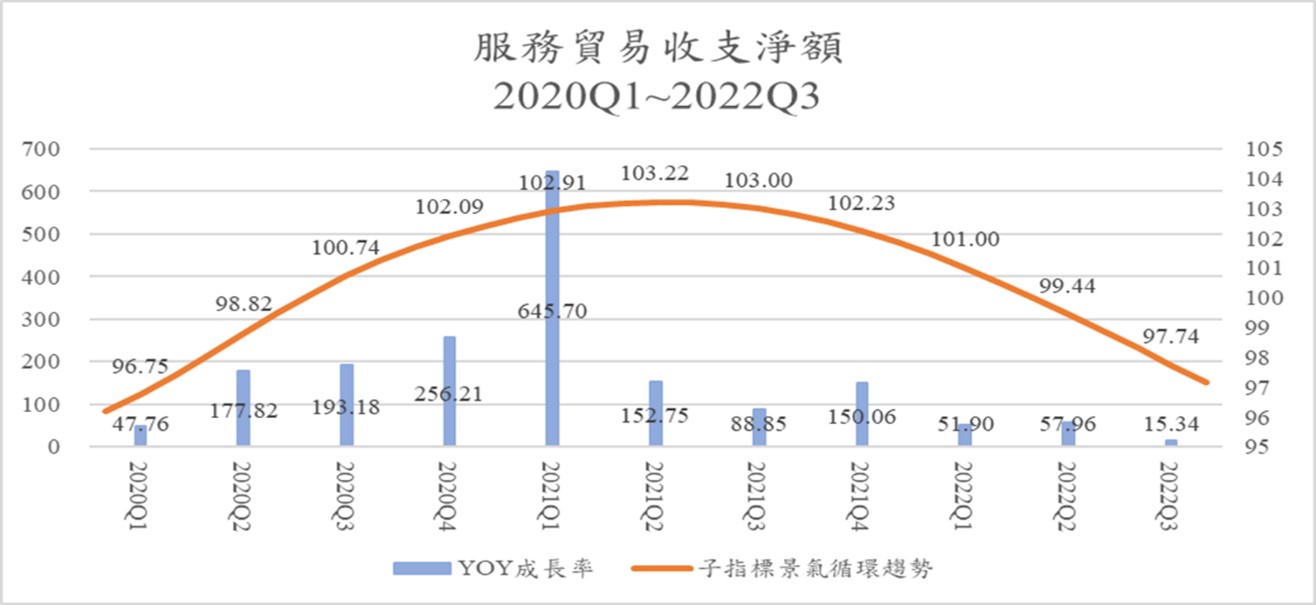
c. Net trade balance in Services Revenue and Expenditure shows that the cyclical tendency value has been exceeding its long-term trend value for a long time, however the cyclical trend has slowed down after surpassing the long-term trend value.
The cyclical tendency of this sub-indicator reached its lowest at 95.1 in September 2019, and then has been rising ever since, reaching the long-term trend level in July 2020 with an index of 100.16 and reached the peak in May 2021and slightly dropped. It started to fall below the long-term trend value in April this year (2022), reaching 96.6 in October 2022 (extrapolated). Taiwan’s service trade, which had suffered a long-term deficit, had a great improvement in net services trade balance since the global pandemic inhibited international tourism in 2020, and then surprisingly turned into a trade surplus in Q2 2020.
The growth rate (YOY) of the net trade balance in Services Revenue and Expenditure in Q1 last year reached its historical high of 645.7% but dropped to 152.75% in Q2, 88.85% in Q3 and 150.1% in Q4, and starts to slow down this year. The growth rate in Q3 was 15.34% left. This shows that the improving path for the Services Revenue and Expenditure has slowed down since Q2 last year.
Figure 5. Annual growth rate and cyclical trend of net trade in Services Revenue and Expenditure, 2020Q1~2022Q3
Source: Business Cycle Forecasting Team, CDRI and Directorate General of Budget, Accounting and Statistics, Executive Yuan
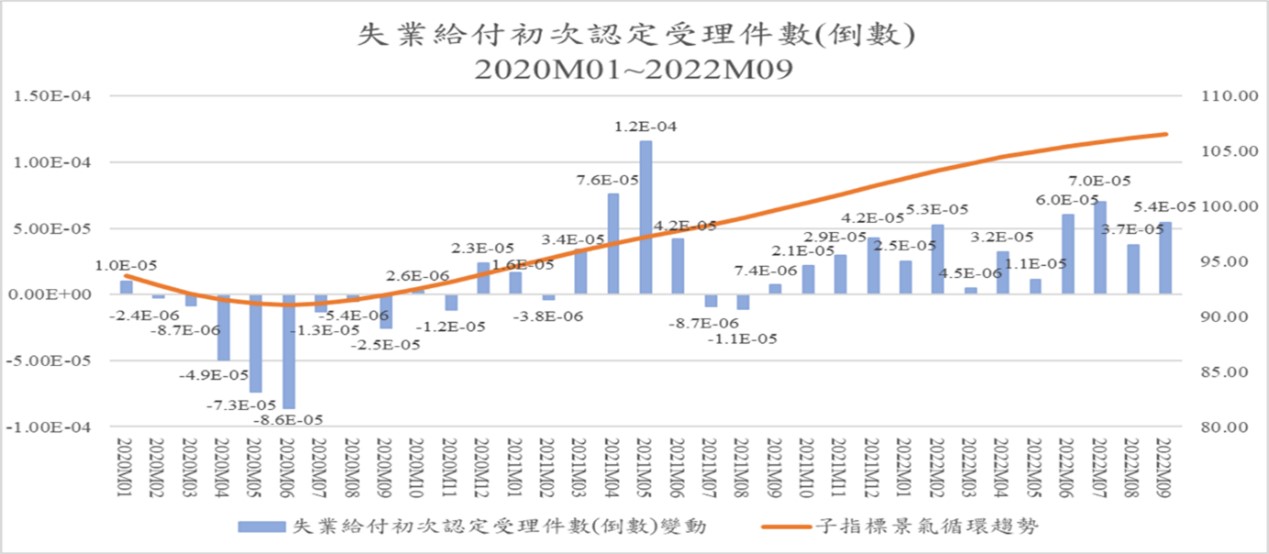
d. Initial Acceptance of Unemployment Benefits (inverted) shows that unemployment pressure is alleviating.
The cyclical tendency of this sub-indicator reached its lowest value of 91.07 in June 2020, and then rose all the way to 100 in October 2021, and 106.85 in October this year. This indicates that the employment demand rapidly increases due to the large amounts of investment from the return of Taiwanese businessmen. Therefore, the number of people applying for unemployment benefits for the first time, a leading indicator to the unemployment rate, has dropped significantly and unemployment pressure continues to ease.
Figure 6. Number of the initial acceptance of unemployment benefits (inverted) and the annual growth rate and cyclical trend January 2020 to September 2022
Source: Business Cycle Forecasting Team, CDRI and Directorate General of Budget, Accounting and Statistics, Executive Yuan
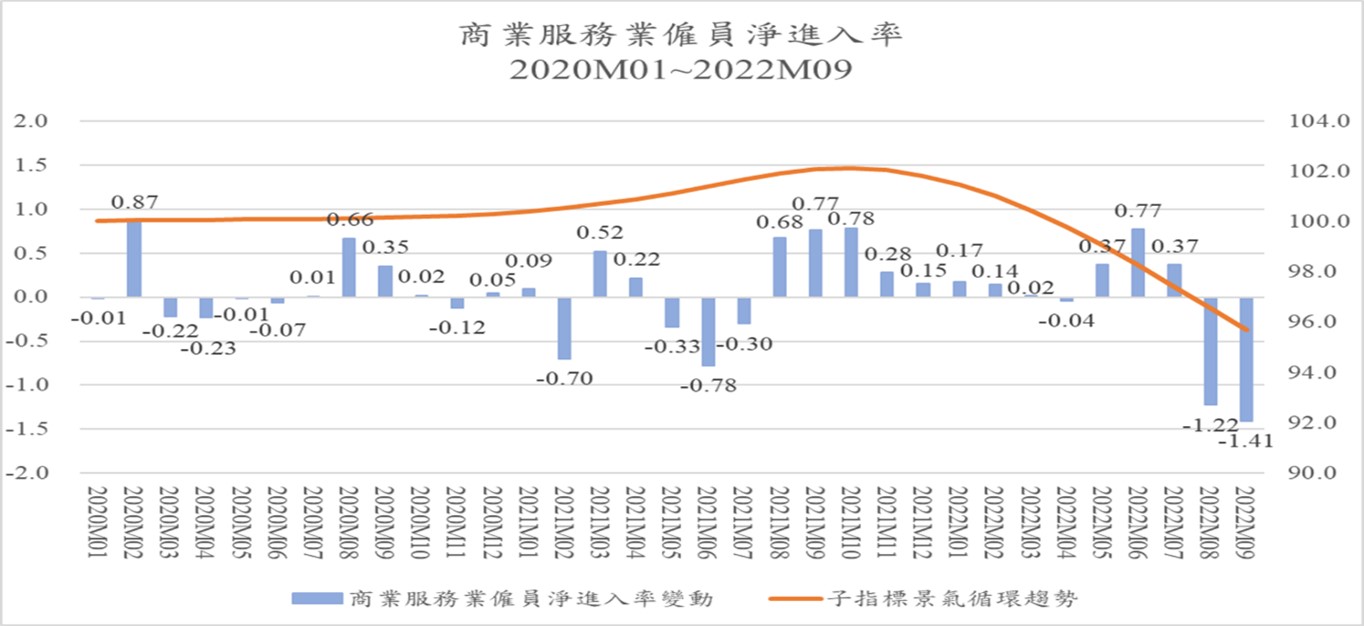
e. Net Entry Rate of Employees in the Commercial Services Industry-hits its peak and turned down, affecting the continued expansion of employment
The cyclical tendency of this sub-indicator reached the bottom of 99.63 in May 2019, and then rose all the way, and reached its peak of 102.15 in October of last year (2021). The index began to fall below the long-term trend in April this year (2022) and had dropped to 94.83 by October. It shows that the expansion of employment in the Commercial Services Industry is continuing to slow down.
Figure 7. Annual changes and cyclical trends in the net entry rate of employees in the commercial service industry, January 2020 to September 2022
Source: Business Cycle Forecasting Team, CDRI and Directorate General of Budget, Accounting and Statistics, Executive Yuan
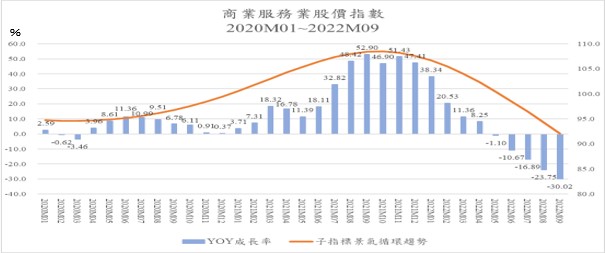
f. Stock Price Index of the commercial services sector starts to decline-the continued expansion of the decline has affected the changes in the economy.
The cyclical tendency of this sub-indicator reached its lowest of 94.63 in March 2020, and then kept rising, reaching its peak 108.45 in October last year. This reflects the prosperity of Taiwan’s general stock market over the past year. However, it appears to be spent, and continued to decline after reaching its peak. It has dropped to 89.91 as of October this year (2022). It shows that the downward trend of the Commercial Services Industry stock market has deteriorated seriously since the beginning of this year.
An indicator is the annual growth rate of the actual Stock Price Index. It has seen double-digit growth since March last year and even reached 32.82% and 48.42% in July and August, respectively. In September and October, the growth rate came to 52.9% and 46.9%, and 51.43% and 47.41% in November and December. However, it then declined ever since, with negative growth since May 2022, and the decline continued to expand. The decline in September even exceeded 30%. Although the reason may not be the influence of operational factors showing the withdrawal of foreign capital, the formation of a trend will inevitably reflect the expectation of changes in the business cycle.
Figure 8. The annual growth rate and circular trend of the Stock Price Index of the commercial service industry, January 2020 to September 2022
Source: Business Cycle Forecasting Team, CDRI and Directorate General of Budget, Accounting and Statistics, Executive Yuan
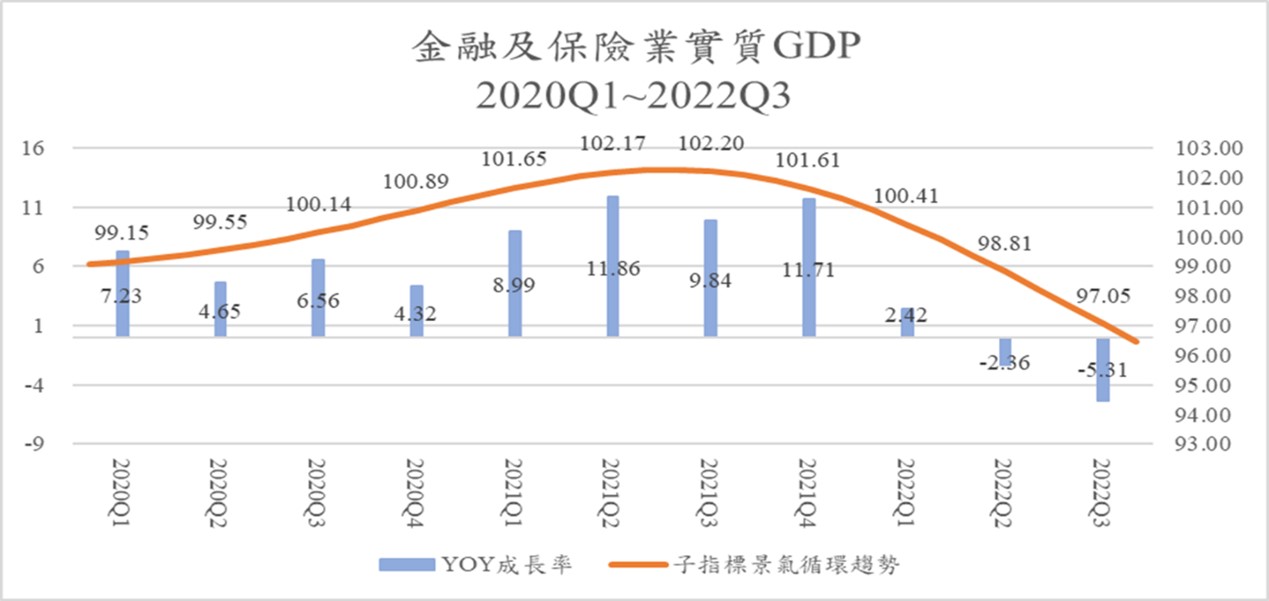
g. Cyclical trend of Real GDP of Finance and Insurance Sector slightly recovers
The cyclical tendency of this sub-indicator got out of the trough by the end of 2020 and began to exceed the long-term trend value (100) at 100.14 in August 2020, and continued to rise slightly, reaching the peak with 102.26 in July 2021, and then slightly decreased afterwards. It fell below the long-term trend value in February this year (2022), and then accelerated its decline. By October, it had dropped to 95.86, indicating that the outlook for the economy isn’t good.
The annual growth rate (YOY), calculated based on its actual value, has been in positive growth since 2021. The growth rate in each quarter last year were: 8.99%, 11.86%, 9.84% and 11.71%, respectively. The positive annual growth rate of its GDP is consistent with its upward cyclical trend. However, since this year (2022), the growth rate has changed from slow to negative, and the growth rate in Q3 was -5.81%, which also confirms the unfavorable situation that the Business Cycle Trend continues to decline and is lower than the long-term trend.
Figure 9. Annual growth rate and cyclical trend of real GDP of Finance and Insurance Sector, 2020Q1~2022Q3
Source: Business Cycle Forecasting Team, CDRI and Directorate General of Budget, Accounting and Statistics, Executive Yuan
B. Coincident indicator series
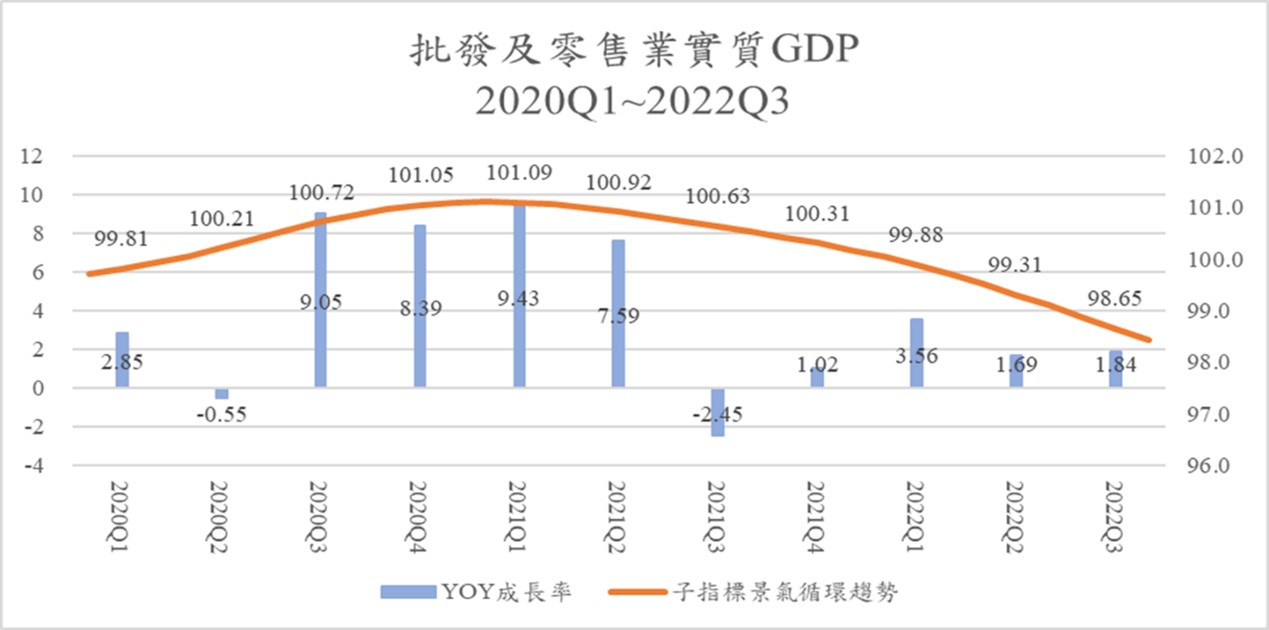
a. The business cycle trend of real GDP Index of Wholesale and Retail is slightly down.
The cyclical tendency of this sub-indicator reached its bottom in September 2019, with an index value of 99.59. It reached its peak of 101.11 in January 2021, then it continually fell. It was lower than the long-term trend value (100) in February last year and dropped to 99.85 in October. It shows that although there are no significant fluctuations alongside the long-term trend value yet, there has been an apparent decline since Q2 this year (2022).
Meanwhile, the actual annual growth has shown growth from 2020 to H1 last year (2021), although in Q3 last year it had a negative growth of 2.45% for the first time before slightly returning to a positive growth of 1.02% in Q4. The growth rates in the first three quarters of this year were 3.56%, 1.69% and 1.84% respectively.
Figure 10. Annual growth rate and cyclical trend of real GDP Index of Wholesale and Retail, 2020Q1~2022Q3
Source: Business Cycle Forecasting Team, CDRI and Directorate General of Budget, Accounting and Statistics, Executive Yuan
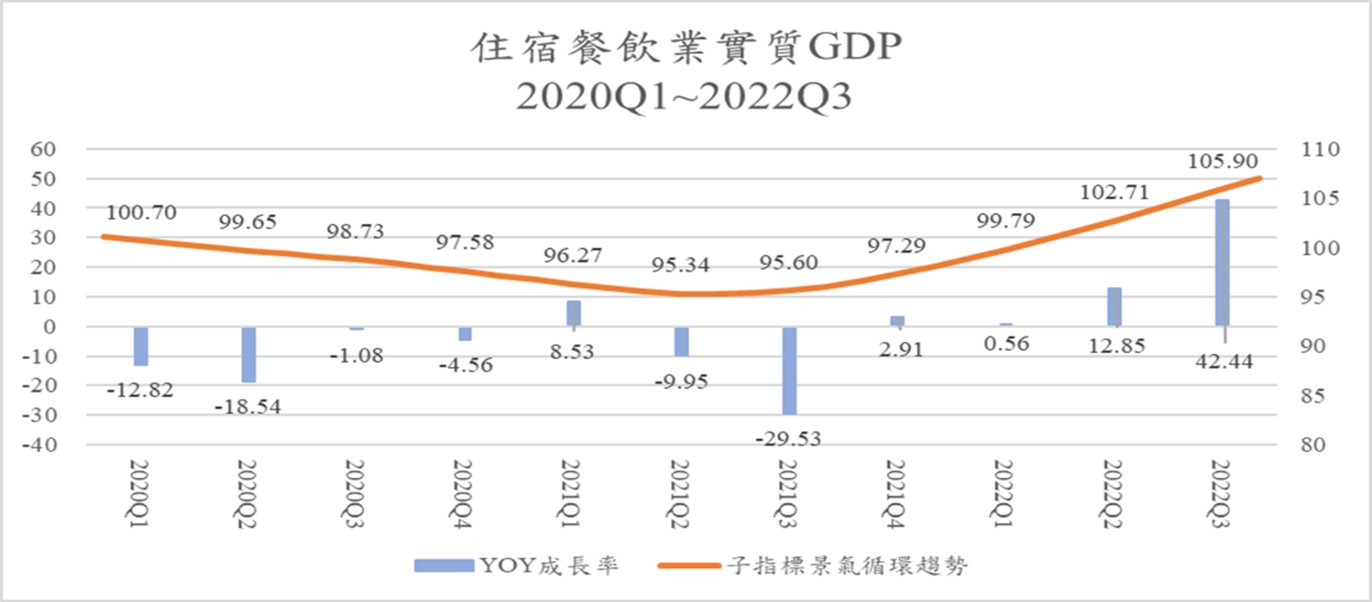
b. Real GDP of the Accommodation and Catering Industry bottoms out in Q3 last year and is continuing to accelerate
The industry has been greatly impacted by the pandemic with the cyclical tendency of this sub-indicator peaking in May 2019 at 103.43, and then falling ever since. It was lower than the long-term value in April 2020 and reach its trough with 95.27 in June last year, before rising. It has returned to above the long-term trend value by March this year (2022), and by October the extrapolated value is 108.06, showing a post-pandemic recovery in the economy.
The actual annual growth has been going down all the way since the growth of 8.53% in Q1 last year (2021). -9.95% in Q2, and -29.53% in Q3. Q4 and Q1 this year (2022) increased slightly by 2.91% and 0.56% respectively. It wasn’t until Q2 and Q3 this year that they rose rapidly, with growth rates as high as 12.85% and 42.44% respectively. The trend of the Business Cycle clearly reflects the trend of the pandemic.
Figure 11. The annual growth rate and circular trend of real GDP in the Accommodation and Catering Industry, 2020Q1~2022Q3
Source: Business Cycle Forecasting Team, CDRI and Directorate General of Budget, Accounting and Statistics, Executive Yuan
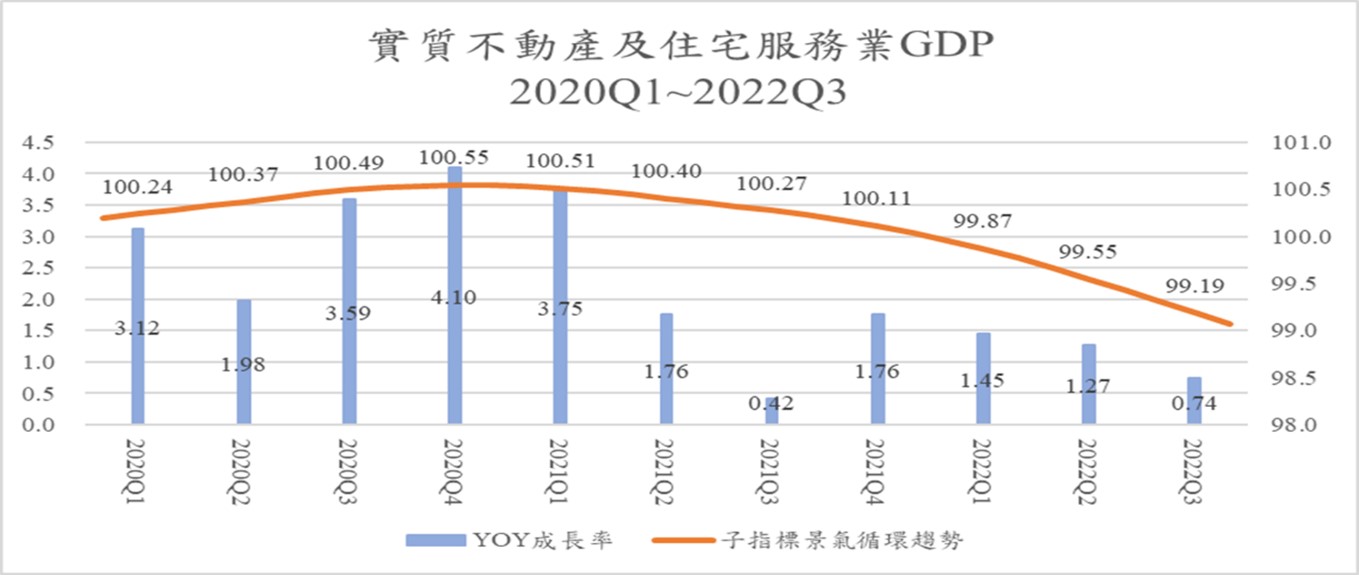
c. Real GDP of Real Estate and Residential Service Industry-business cycle trend grow slightly.
The cyclical tendency of this sub-indicator fluctuates slightly over the long-term. The index peaked in November 2020, with a value of 100.55 and then slightly decline. It was lower than the long-term trend by January 2022 and continued to decline with an extrapolated value of 98.95 in October.
The actual annual growth rate has shown a continuing growth; however, it has slowed down since Q2 last year. It only grows 0.74% in Q3 this year.
Figure 12. Annual GDP growth rate and cyclical tendency of Real Estate and Residential Service Industry, 2020Q1~2022Q3
Source: Business Cycle Forecasting Team, CDRI and Directorate General of Budget, Accounting and Statistics, Executive Yuan
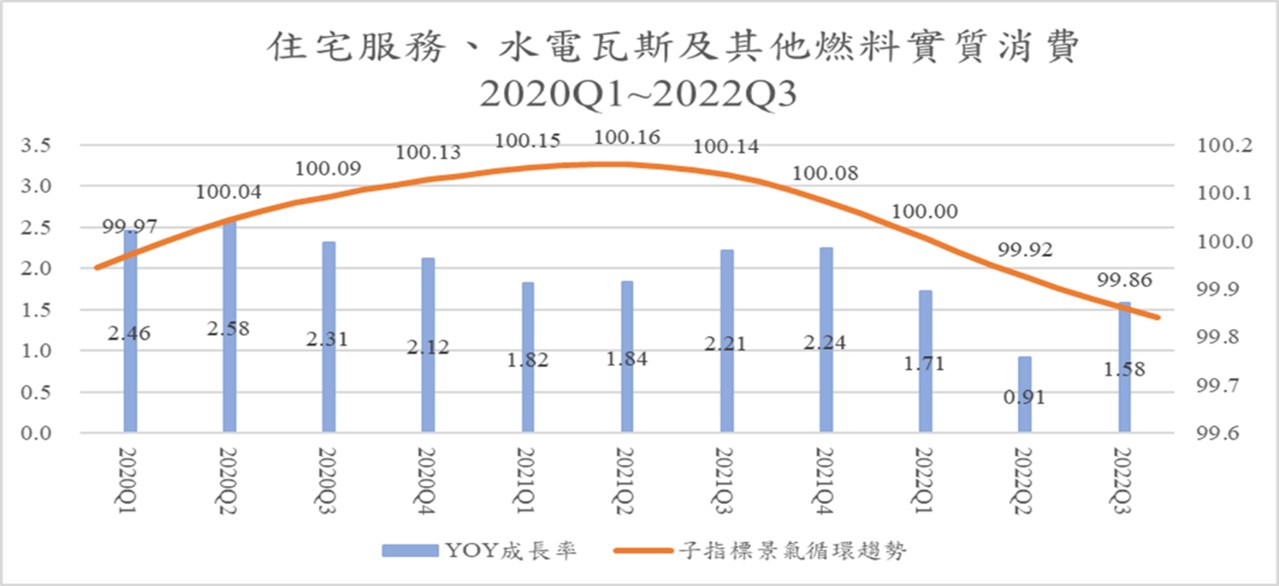
d. Residential Services, Utilities, and Other Fuel Industries-continues to grow slightly while the business cycle trend turns downwards.
The cyclical tendency of this sub-indicator showed little long-term fluctuation. It reached the bottom in April 2019, with an value of 99.78, and then kept rising slightly before reaching its peak of 100.16 in April last year (2021). It then declined all the way until October this year at 99.8 (extrapolated).
Meanwhile, the actual annual growth rate has seen a slightly positive growth since 2020. The annual growth rate fluctuates between the highest 2.58% and the lowest 0.91%.
Figure 13. Real Consumption of Residential Services, Utilities, and Other Fuel Industries, 2020Q1~2022Q3
Source: Business Cycle Forecasting Team, CDRI and Directorate General of Budget, Accounting and Statistics, Executive Yuan
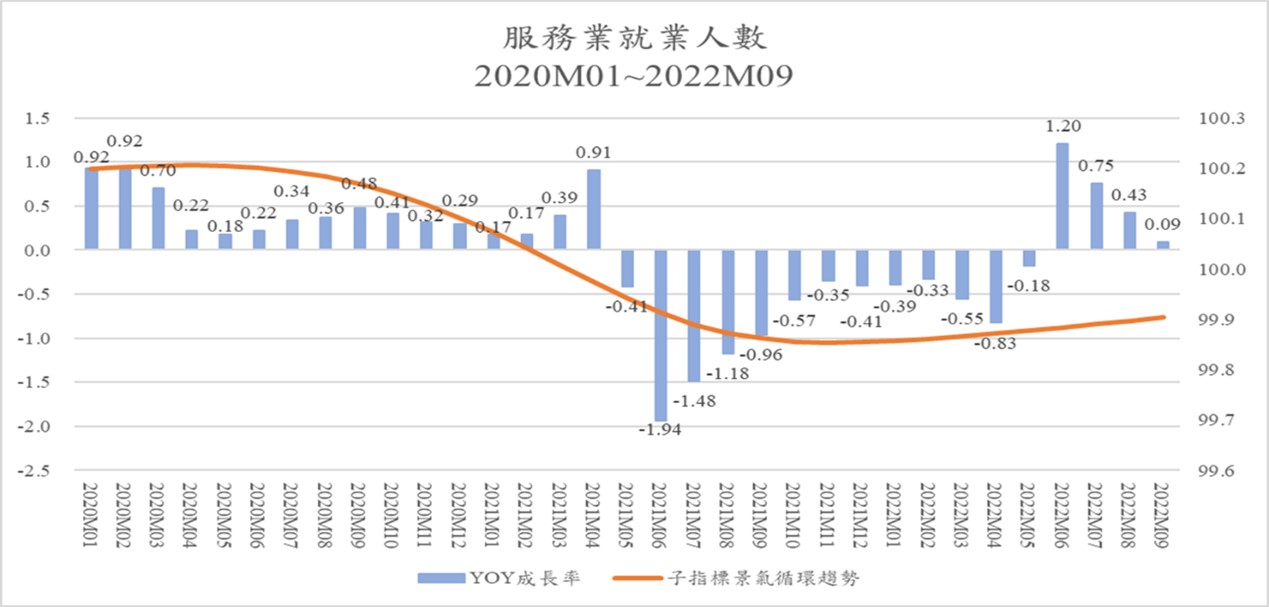
e. Number of employees in the Service Industry- has slightly increased since this year.
The cyclical tendency of this sub-indicator peaked in April 2020 with an index of 100.21, and then fell below the long-term tendency value at 99.98 in April 2021. And then reached the bottom in November last year, with an index of 99.85. It shows that the rate of decline was minimal, and the rate of decline only increased slightly in Q2 and Q3 last year, and the growth rate after getting out of the bottom was also extremely limited.
The actual annual growth rate has seen a limited growth from January 2020 until this April. The growth rate peak never hit a high of 1% and it started to grow negatively. Negative growth was seen from May last year to May this year, especially in Q2 and Q3 last year. This was due to the recurrence of the pandemic, which has reduced demand for labor due to the recession. Growth has turned positive since June this year, but the growth rate is still limited. The average growth rate from June to September was only 0.62%, and the growth rate slowed down month by month. The growth rate in September was only 0.09%.
Figure 14. The growth rate and cyclical tendency of The Number of Employees in the Service Industry, January 2020 to September 2022
Source: Business Cycle Forecasting Team, CDRI and Directorate General of Budget, Accounting and Statistics, Executive Yuan
C. Lagged indicator series
The lagged indicator includes Real Consumption of Tobacco and Alcohol, Real Consumption of Clothing, Footwear, and Apparel, Real Consumption of Furniture, Equipment, and Housekeeping, and the Number of Initial Recognition and Acceptance of Unemployment Benefits. The Lagged Index can be used as a reference for observing whether a business cycle is over. This article omits relevant analysis.
Appendix
Business Cycle Coincident Composite Index for Taiwan Service Sector
|
Year/Month
|
Deviation of Standardized Cyclical Coincident Composite Index
(Unit: σ, Benchmark: 0)
|
Remark
|
|
2023-04
|
-0.2411
|
(P)
|
Use ARMA Model: (4,0)(0,0) to make predictions based on the leading effect set for half year
|
|
2023-03
|
-0.2392
|
(P)
|
|
2023-02
|
-0.2377
|
(P)
|
|
2023-01
|
-0.2376
|
(P)
|
|
2022-12
|
-0.2394
|
(P)
|
|
2022-11
|
-0.2434
|
(P)
|
|
2022-10
|
-0.2495
|
(f)
|
The estimated value of the Coincident Composite Index
|
|
2022-09
|
-0.2572
|
(a)
|
The actual value of the Coincident Composite Index
|
|
2022-08
|
-0.2656
|
(a)
|
|
2022-07
|
-0.2735
|
(a)
|
|
Source: Business Cycle Forecasting Team, CDRI
Note: (a): actual; (f): estimated; (p): predicted
|