CDRI released Business Cycle Composite Index for Taiwan Service Sector, indicating declination in Q1 next year. The result of the prediction is worse than the what we obtained before due to the “stock disaster in October”. The forecasted coincident composite index fell all the way to March next year from its downward point in August. The reason for the forecast is worse than the previous one is that the stock index cycle value in the leading indicator has fallen in October, and the employment situation since March this year has been deteriorating, though rebounded in September.
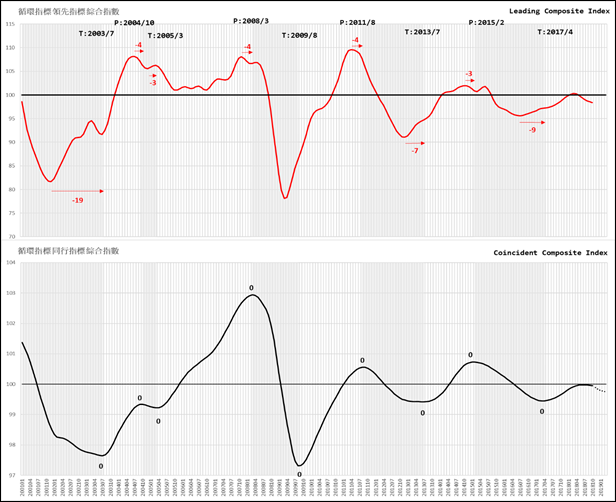
A. Leading index of service industry declined conspicuously as the prediction in Q2, which has been falling for six months since September.
Cyclical Leading Composite Index for service industries ( the cycle value without long-term trend) The actual value formed several peaks in March this year, and then fell all the way. Its cycle index has fallen from 100.29 in March to 98.7 in September, falling back to the level of October last year.
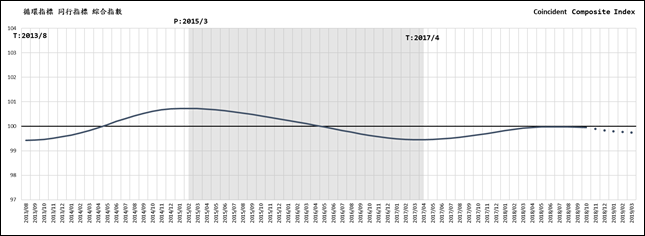
The actual cycle value which predicted by its coincident composite index formed several peaks in July this year, showing that it will fall back to around 99.7 in March next year as the end of last year (as shown below). It shows that the business trend of Taiwan's business services industry is slowly declining.
B. The six sub-indicators of the leading indicators are showing signs of weak employment. The service industry's trade balance was predicted to worsen in September, and the stock market’s falling in October is also an unfavorable factor. Although the formation of transportation and warehouse and private capital continued to rise, there is still not enough to make up for it. The leading composite index continues to decline, and it is expected that the return of Taiwanese people in business will play a significant role in improvement.
C. Sub-indicators of the coincident index varies which affecting the recovery of the composite index
The Taiwan service industry resumed from its recession in March 2015 and recovered in May 2017. The actual value shows that the coincident composite cycle index (excluding long-term trend) has been rising to June this year. However, the actual value of the leading composite index from February to June and the predicted value from July to October show that it will start to decline in August and will continue to decline to 99.73 in March next year. The cycle index level returned to the end of last year which means that the current economy has slowed down.
The sub-indicators in the coincident index (which can synchronously reflect the real GDP changes in the service industry) show different trends in different sectors.
(Business Cycle Indicator System is designed, instructed and analysed by professor Tain-Tsair Hsu)
|
Business Cycle Coincident Composite Index for Taiwan Service Sector
|
year/month
|
Cycle index(Trend value=100)
|
Remark
|
|
2019-03
|
99.7446
|
(p)
|
Predicted by leading indicator from July to October August 2018
|
|
2019-02
|
99.7684
|
(p)
|
|
2019-01
|
99.7929
|
(p)
|
|
2018-12
|
99.8341
|
(p)
|
|
2018-11
|
99.8920
|
(f)
|
Forecast based on the actual value of the leading composite index from February to June 2018
|
|
2018-10
|
99.9522
|
(f)
|
|
2018-09
|
99.9632
|
(f)
|
|
2018-08
|
99.9699
|
(f)
|
|
2018-07
|
99.9728
|
(f)
|
|
2018-06
|
99.9727
|
(a)
|
Coincident composite index actual value
|
Source:Business Cycle Forecasting Team, CDRI
|
a. (actual)
f. (forecast)
p. (predicted)
|
Business Cycle Composite Index for Taiwan Service Sector
|
Business Cycle Composite Index for Taiwan Service Sector
Source:Business Cycle Forecasting Team, CDRI
Previous cycle:
|
Cycle
|
Trough
|
Peak
|
Trough
|
|
1
|
2003/7
|
2004/10
|
2005/3
|
|
2
|
2005/3
|
2008/3
|
2009/8
|
|
3
|
2009/8
|
2011/8
|
2013/7
|
|
4
|
2013/7
|
2015/2
|
2017/4
|