Authors:Tain-Tsair Hsu(許添財)Shih-Hsien Chen(陳世憲)
The fluctuations of the pandemic, the tightness of pandemic prevention alert, and the rotation of relief and revitalization measures have become important factors that dominate the short-term fluctuations in the commercial service industry. Economic resilience is different, recovery is unequal among each sector. Thus, the main commercial services industry is still in recession in the third quarter. With the leading indicators recovered strongly, it is predicted that the composite index of coincidental indicators is expected to bottom up in November. Containing the same circumstances, the commercial service industry will be able to recover early next year.
Virus variants ever bring a high risk of uncertainty. After the Delta ravaged the world, certain countries have gradually lifted border closures. But the Omicron has appeared violently in many countries, which has revived the discussion of lockdowns in some countries. While Taiwan is strictly awaiting pandemic prevention, rescuing decline and revitalization should not be neglected. Under the concern of international inflation and the domestic speculation threats, it is more appropriate to implement efforts that contribute to real investment and increase productivity. It is more important to adopt delicate and precise “tailor policy” as a function of both pandemic prevention and the creation of “alternative mobility”.
1. Comprehensive analysis and prediction
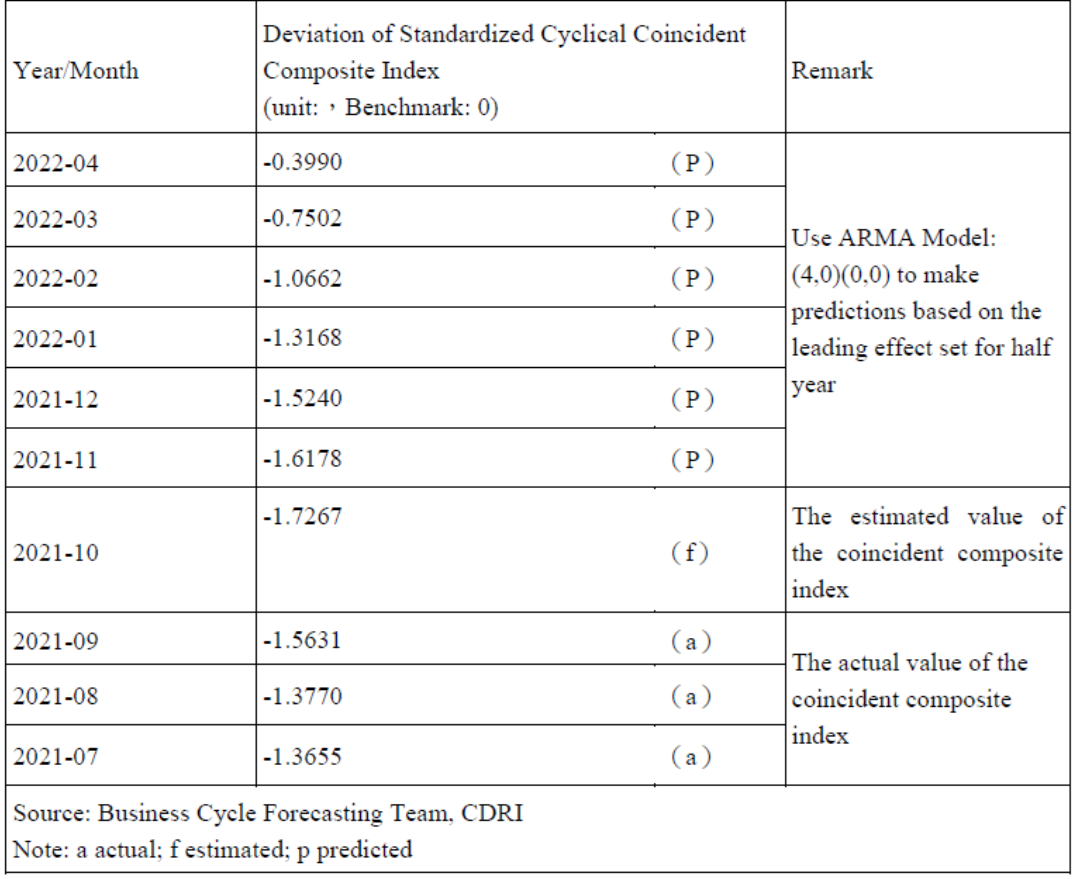
The Commerce Development Research Institute (CDRI) found the Coincidental Cyclical Composite Index for Service Industry (CCCIS) will continue to drop to -1.727 standard deviations in October 2021, but it is predicted that it will bottom up again, and it will continue to improve to -0.399 standard deviations by April 2022.
This time of depression shows another severe situation since the Global Financial Crisis of 2008 (there was a trough in June 2009, with a -1.95 standard deviation), has bottomed out in only three months. It shows the commercial service industry’s business deteriorated rapidly with the escalation of the pandemic alert, and then quickly recovered with the release of the pandemic alert and the help of an immediate economic relief and revitalization measures.
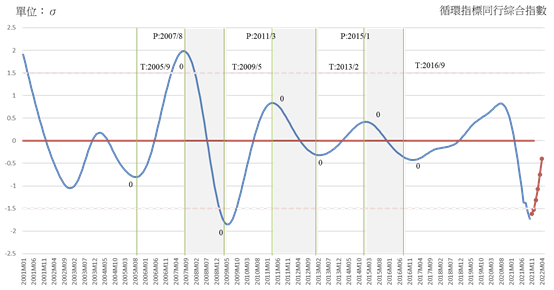
Figure 1 “Tendencies and Forecasts of the Coincidental Cyclical Composite Index for the Service Industry”
Source: Business Cycle Forecasting Team, CDRI
The impact of the pandemic has caused disagreement between different sectors and industries in the economic recovery in 2020. The recurrence of the pandemic this year has severely damaged those who have been severely affected by the pandemic for the second time. The overall economic growth rate in the third quarter is no longer as vigorous as in the first half of the year. (Note: Released on November 26, 2021, yoy, Q1: 9.2%; Q2: 7.76%; Q3: 3.7%)
Directorate General of Budget, Accounting and Statistics, Executive Yuan announced that the annual economic growth rate (yoy) for the first three quarters of this year was as high as 6.8%. The momentum of private investment is strong, and it has returned to the top of its growth contribution.
According to the sector, the net output, the top growth driving force in the first half of the year, grew by 20.07% in the first three quarters, and the contribution rate has dropped to 2.91%. Private investment, with a growth rate of 19.1% and a contribution rate of 3.75%, has regained the top of the rank. The remaining sectors continue to show signs of decline. The contribution of private consumption and government consumption are -0.57% and 0.44%. The contribution of government and public sector investment was -0.21% and 0.05%. Inventory investment has grown significantly by 370.23%, with a contribution of 0.65%. It should be an international supply chain disruption and short supply. Producer prices are expected to rise, and Taiwan is speeding up for the material preparation and improving equipment utilization rates are promising signs of the business cycle.
Table 1. The economic growth rate, and contribution rate of each sector in the first half of 2021
Unit: Millions of New Taiwan Dollars, %
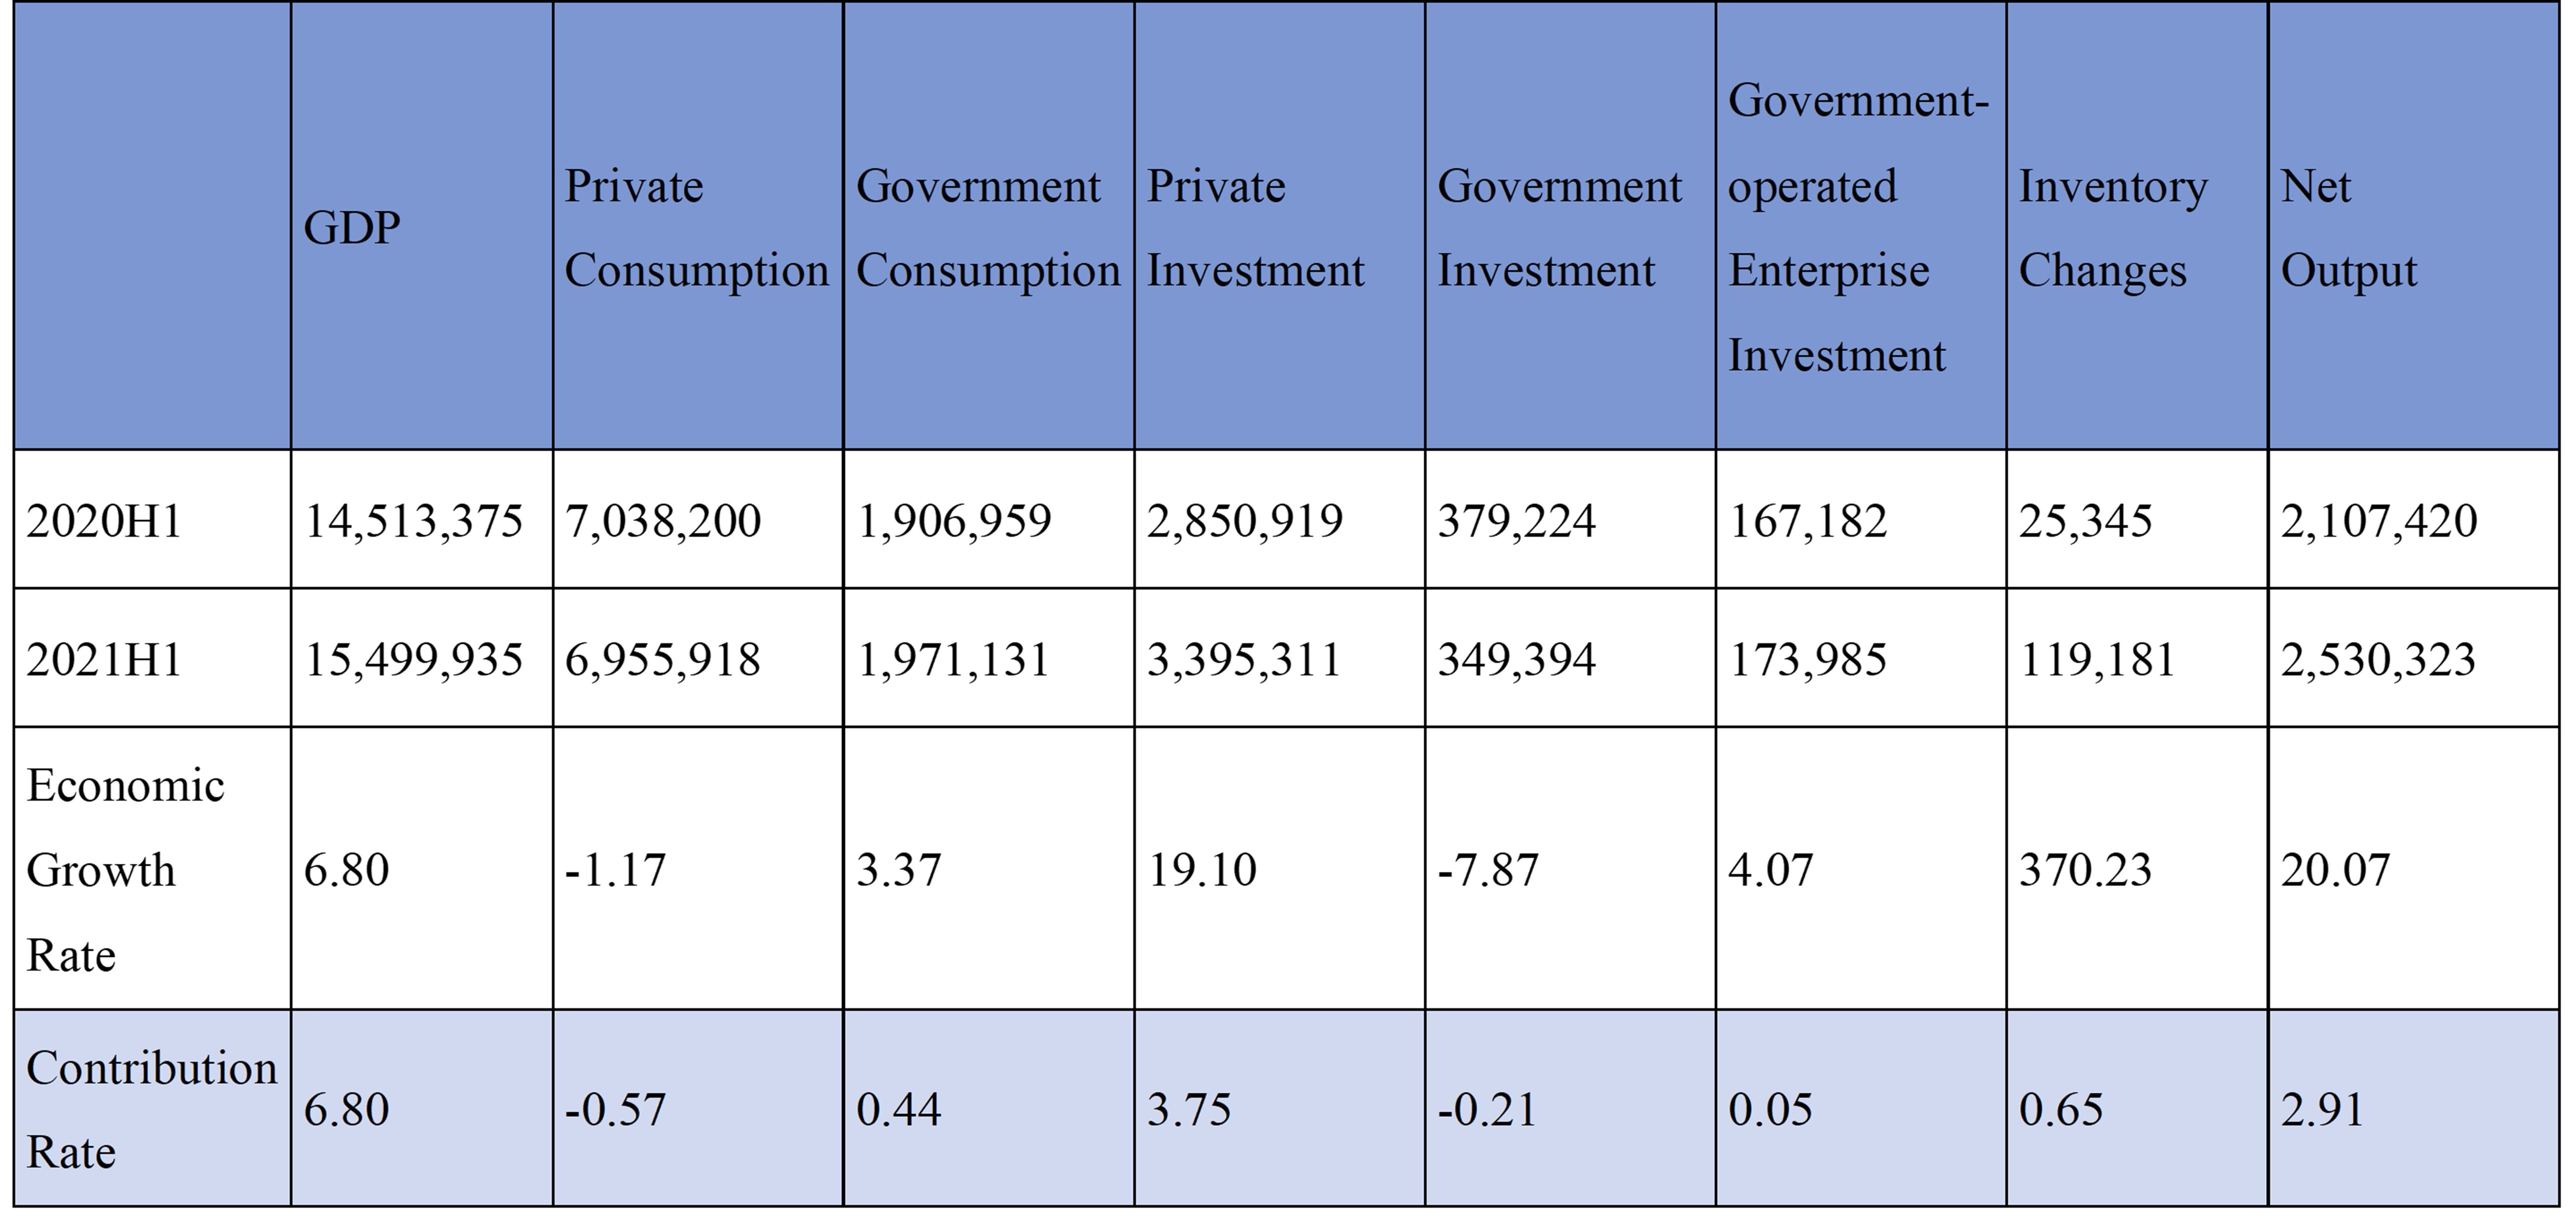
Source: The Directorate-General of Budget, Accounting and Statistics, Executive Yuan, and the Business Cycle Forecasting Team of CDRI
According to the industry category, the main driving force is industry, with a growth rate of 13.98% and a contribution rate of 5.31%; followed by the service industry, a growth rate of 3.15% and a contribution rate of 1.9%; however, both the growth rate and contribution rate of agricultural sector are negative.
A cross-examination of sectors and industries reveals that under the impact of the pandemic, private enterprises have been prospering in investment, manufacturing, and exports, while domestic demand for private products and service consumption is sluggish, resulting in serious imbalances.
Table 2. The economic growth rate and contribution rate of each industry in the first three quarters of 2021 Unit: Millions of New Taiwan Dollars, %
|
|
GDP
|
Agricultural
|
Industry
|
Service Industry
|
|
2020H1
|
14,513,375
|
258,906
|
5,512,197
|
8,742,623
|
|
2021H1
|
15,499,935
|
254,453
|
6,282,898
|
9,017,820
|
|
Growth Rate
|
6.80
|
-1.72
|
13.98
|
3.15
|
|
Contribution Rate
|
6.80
|
-0.03
|
5.31
|
1.90
|
Source: Directorate-General of Budget, Accounting and Statistics, Executive Yuan, and the Business Cycle Forecasting Team of CDRI
2. The outlook of business cycle for service industry
The compilation of the composite index system of the business cycle was based on the research of the business cycles. We analyze the relevant economic indicators in time series and screen out those with the significance of the business cycle and the stability of their cyclicality. It is classified into leading indicators, coincident indicators and lagged indicators by statistical analysis and verification. It has proved that the cyclical tendency composite index of coincident indicators is highly correlated with the cyclical trend of GDP, and the forecast value of the composite index of the coincident indicators, estimated by the leading indicator composite index, can be used as a forecast for the trend of GDP changes.
The economic cycle trend of economic indicators fluctuates around the long-term trend. The long-term trend value is as 100, and the cycle trend value is greater than 100 as the recovery or prosperity stage; below 100 means it’s in the recession or depression stage.
The standardized indicator cycle trend value (in standard deviation unit) is added up to become a composite index, and it fluctuates around the long-term trend value with a standard deviation of 0. The leading and coincident composite indicator curve of this cycle indicator system is shown in Figure 2.
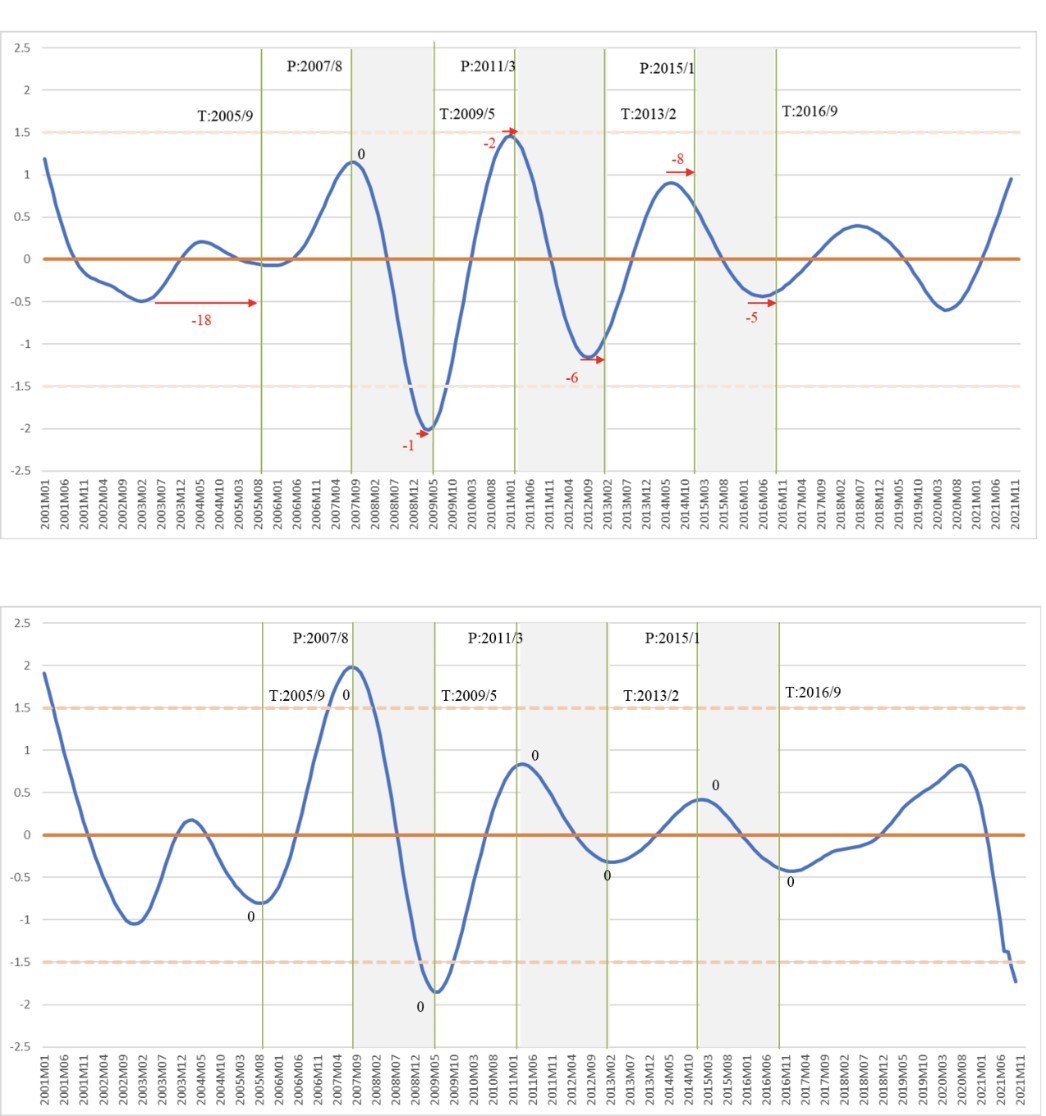
Figure 2. The trends of Leading and Coincidental Cyclical Composite Index for the Service Industry
Source: Business Cycle Forecasting Team, CDRI
Leading cyclical composite index (LCCIS) has reached the bottom in May 2020 and has lasted for 17 months until October this year. The cyclical composite index has changed from a negative 0.598 standard deviation to a positive 0.052 standard deviation in March 2021 and has reached a positive 0.95 standard deviation in October.
Coincidental cyclical composite index (CCCIS) is directly affected by the pandemic, falling from a positive 0.822 standard deviation at its peak in August 2020 and becoming a negative 0.122 standard deviation in March 2021. It has fallen to a negative 1.727 standard deviation in October this year. (It is predicted that it will stop falling and rebound, and it is expected to return to a negative 0.399 standard deviation in April next year.)
A. Leading indicator series
a. Real GDP of Transportation and Storage
The cyclical tendency value of this sub-indicator reached bottom, 97.26, in October 2020, and then it rose to 98.36 (the estimated value) in October this year. Obviously, although the trend is slightly recovering, it is still below the long-term trend level.
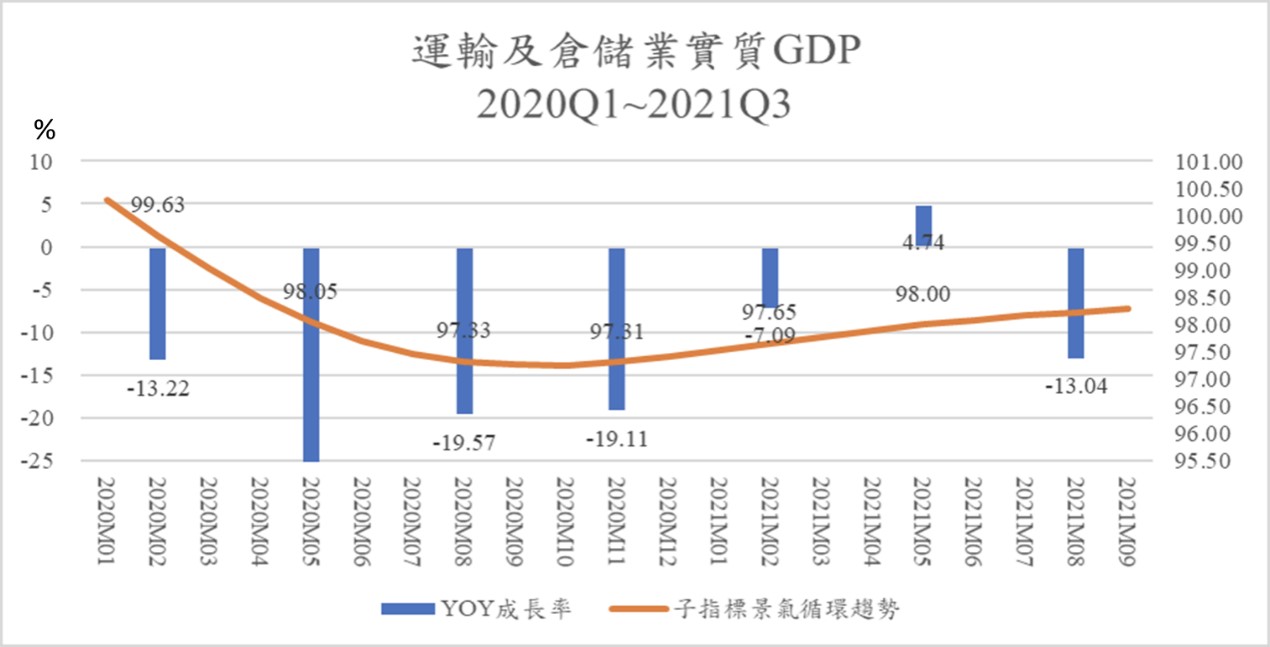
Figure 3. The annual growth rate of transportation and storage GDP and the trend of business cycle, 2020Q1~2021Q3
Source: Business Cycle Forecasting Team, CDRI
b. The Private Real Fixed Capital Formation
The cyclical tendency value of this sub-indicator reached its lowest, 98.4, in July 2020, and then exceeded the long-term trend value of 100 in February this year. It reached 104.94 (the estimated value) in October this year, showing that it has passed the stagnation period, and it is recovering strongly.
The annual growth rate (yoy), calculated based on its actual value, has been positive in each quarter since 2020. What’s more, the three quarters of this year have increased by 13.59%, 18.9% and 24.63% respectively.
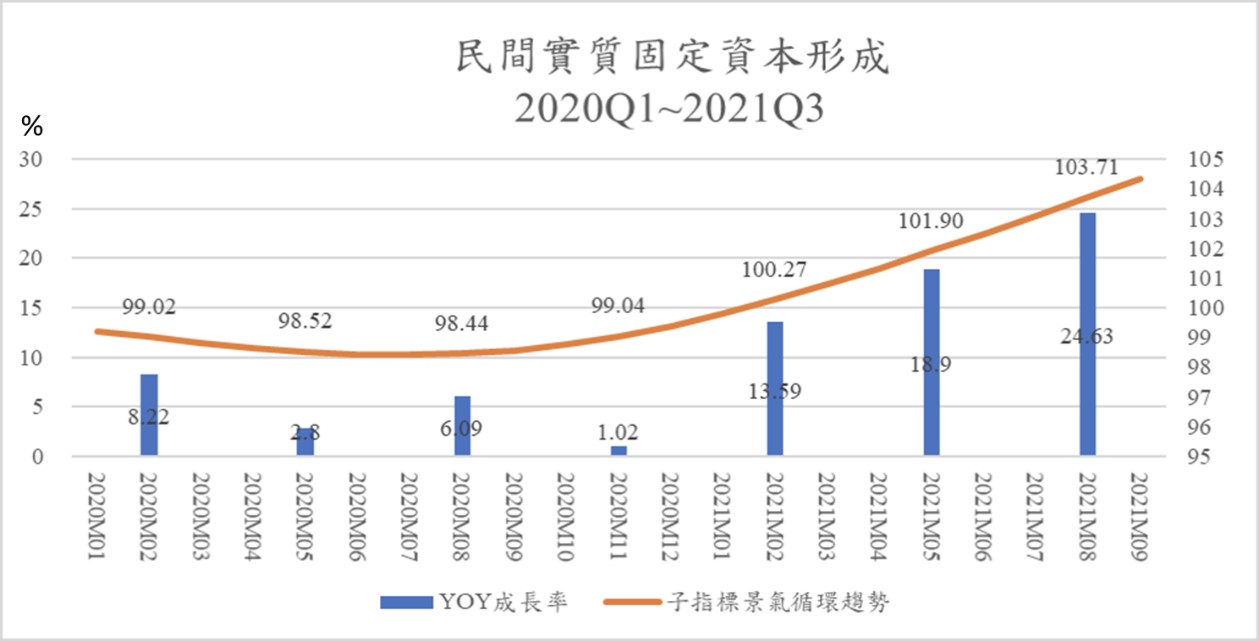
Figure 4. Annual growth rate and circular trend of private real fixed capital formation, 2020Q1~2021Q3
Source: Business Cycle Forecasting Team, CDRI and Directorate General of Budget, Accounting and Statistics, Executive Yuan
c. Net trade balance in services revenue and expenditure
The cyclical tendency of this sub-indicator reached the lowest, 95.56, in September 2019, and then rose all the way, reaching the long-term trend level in July 2020, with an index of 100.4. It reached the top in April 2020, with an index of 102.55, and slightly turned down to 102.17 in October 2021 (estimated).
The trade in services, which had a long-term deficit, will greatly improve Taiwan’s net services trade balance after the international pandemic blocked the flow of international tourism in 2020, and then turned into a surprising trade surplus in the second quarter last year. The net trade balance in services revenue and expenditure in the first quarter of this year reached its historical high, with a 647.66% growth rate (yoy). It dropped to 157.42% in the second quarter and 34.32% in the third quarter. It shows that the improvement trend of the net trade balance has slowed down since the second quarter this year.
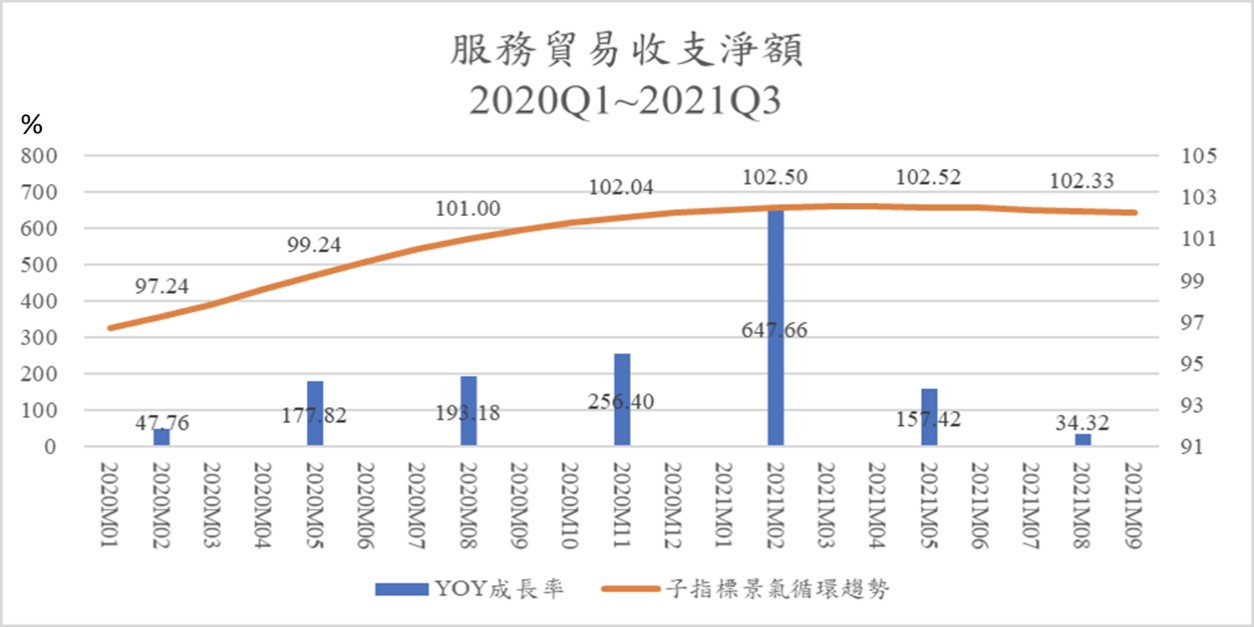
Figure 5. Annual growth rate and cyclical trend of net trade in services revenue and expenditure, 2020Q1~2021Q3
Source: Business Cycle Forecasting Team, CDRI and Directorate General of Budget, Accounting and Statistics, Executive Yuan
d. The initial acceptance of unemployment benefits (inverted)-shows the unemployment pressure is alleviating
The cyclical tendency of this sub-indicator reached its lowest, 93.07, in April 2020, and then rose all the way, exceeding the long-term trend value of 100 in January 2021, and reaching 107.04 in October this year, indicating that the employment demand rapidly increases due to the large amounts of investment from the return of Taiwanese businessmen. Therefore, the number of people applying for unemployment benefits for the first time, a leading indicator of the unemployment rate, has dropped significantly. This should basically be an indicator of the overall economy. But it is not necessary to be a phenomenon that may occur in the service industry. However, compare with the net entry rate of employees in commercial service industry below, with the business cycle index exceeding the long-term trend value in May this year, it shows that the leading indicators of employment in the service industry has indeed been improving significantly.
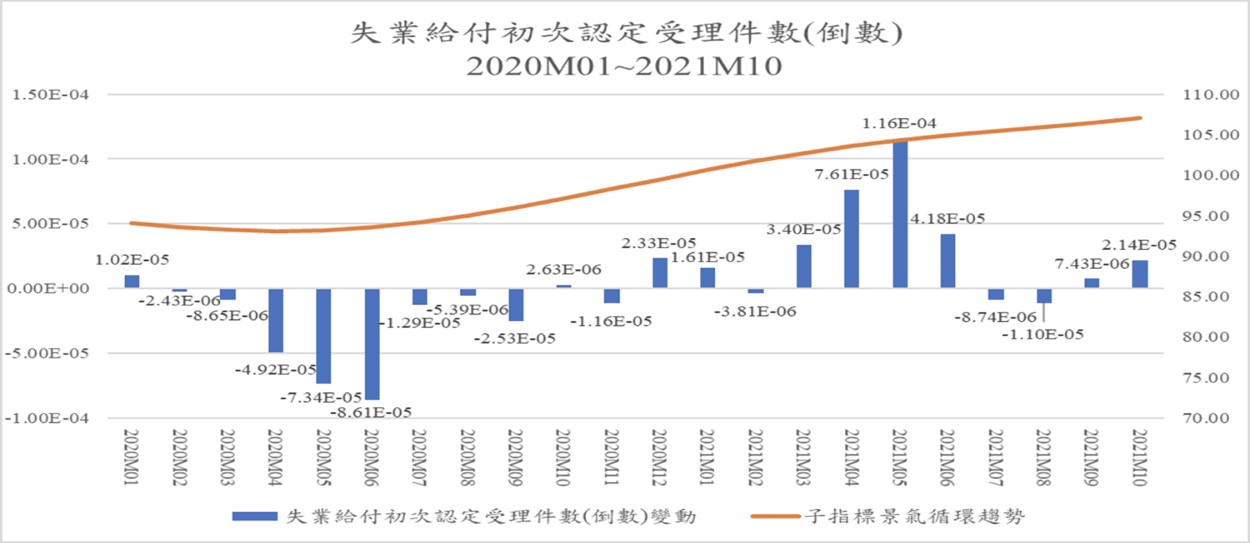
Figure 6. Number of the initial acceptance of unemployment benefits (inverted) and the annual growth rate and circulation trend January 2020 to October 2021
Source: Business Cycle Forecasting Team, CDRI and Directorate General of Budget, Accounting and Statistics, Executive Yuan
e. The net entry rate of employees in the commercial services industry-the business cycle trend that crosses the long-term trend value will lead to employment improvement
The cyclical tendency of this sub-indicator reached its peak, 100.25, in December 2019, and then fell all the way and reached 99.44 in this January. It shows that employment demand in the service industry has been severely impacted by the pandemic, which is contrary to the boom in the manufacturing industry. The changes in the actual value of this indicator during this period also showed a downward trend. But then it stopped falling and rebounded in February this year, and it has accelerated to 102.52 in October. When the leading indicator has rebounded, the coincident indicator of total employment and the lagged unemployment rate will also improve after a certain period of time.
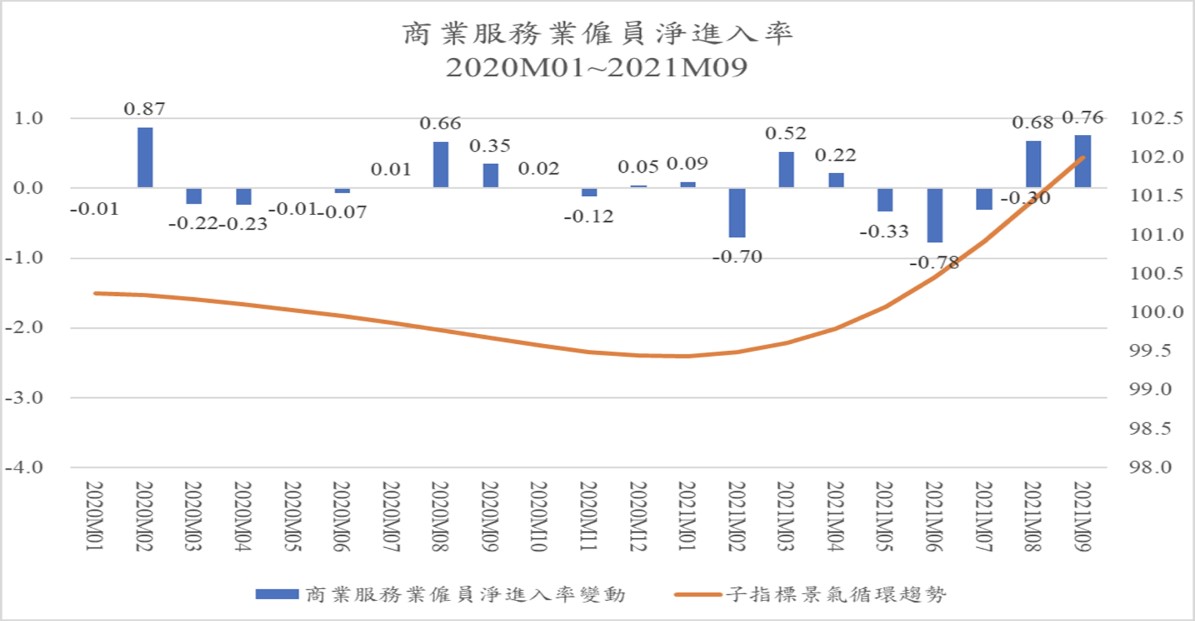
Figure 7. Annual changes and cyclical trends in the net entry rate of employees in the commercial service industry, January 2020 to September 2021
Source: Business Cycle Forecasting Team, CDRI and Directorate General of Budget, Accounting and Statistics, Executive Yuan
f. The stock price index of the commercial services sector
The cyclical tendency of this sub-indicator reached the lowest, 93.95, in June 2020, and then kept rising all the way, exceeding the long-term trend level in February this year, and reached 100.92 this April, even up to 111.31 in October. This reflects the prosperity of Taiwan’s general stock market since the beginning of this year. The impact of the pandemic has accelerated the development of digital transformation, which contributes to the investment and development of the commercial service industry, and in turn makes the relevant commercial service industry stock market promising.
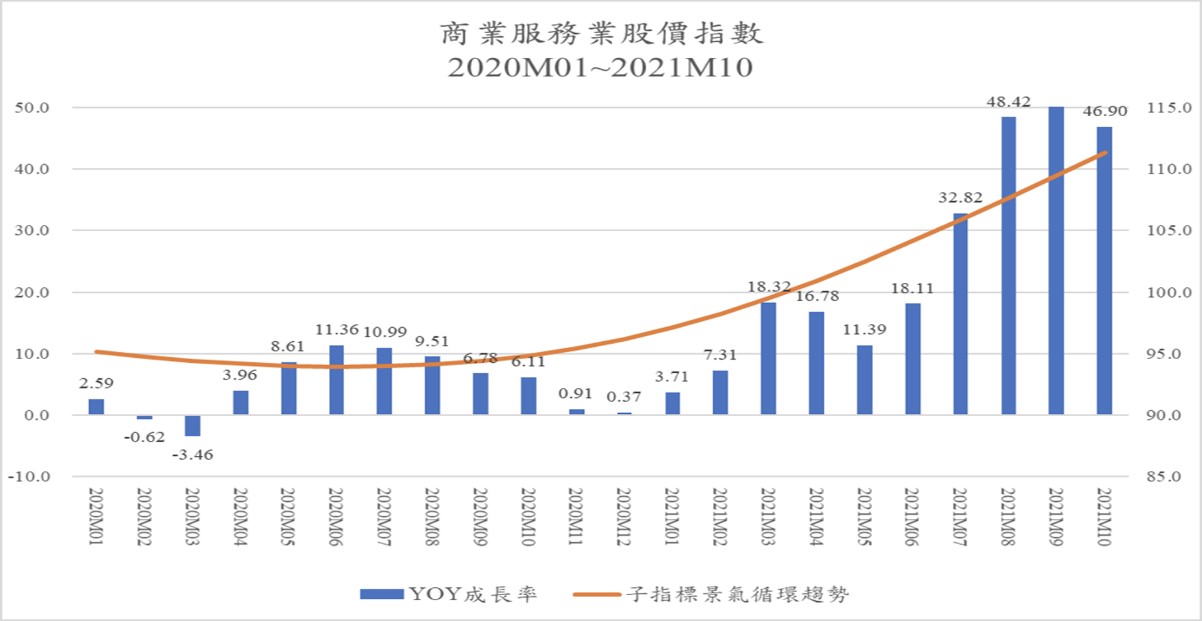
Figure 8. The annual growth rate and circular trend of the stock price index of the commercial service industry, January 2020 to October 2021
Source: Business Cycle Forecasting Team, CDRI and Directorate General of Budget, Accounting and Statistics, Executive Yuan
g. The Real GDP of Finance and Insurance Sector-continue to recover slightly
The cyclical tendency of this sub-indicator was out of the trough at the end of 2020. The business cycle index began to exceed the long-term trend value (100) at 100.14 in December 2020, and continued to rise, reaching 102.03 in October 2021. Of course, the rate of increase is not as exuberant as the stock market.
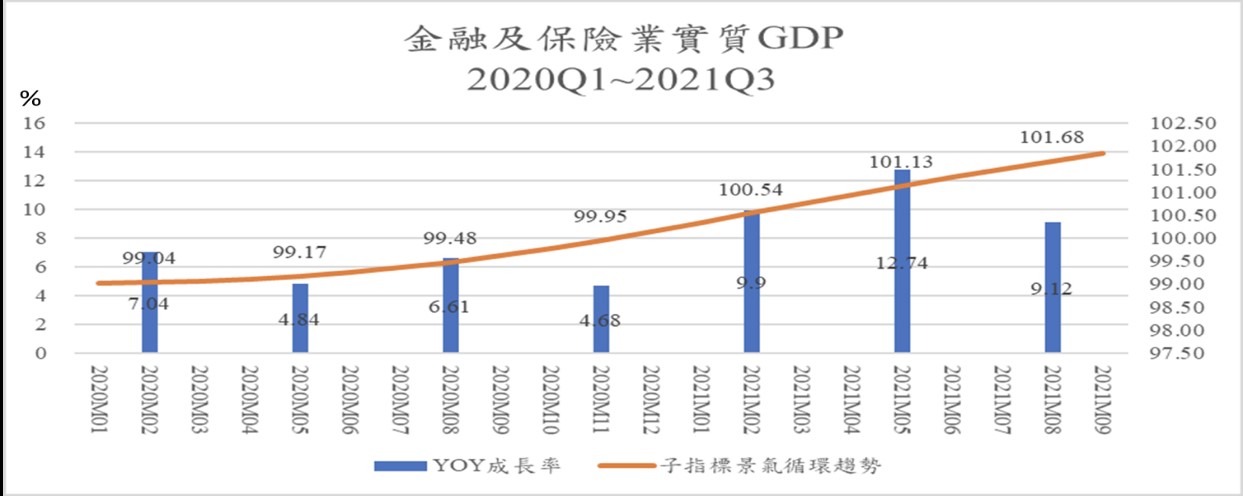
Figure 9. Annual growth rate and cyclical trend of real GDP of Finance and Insurance Sector, 2020Q1~2021Q3
Source: Business Cycle Forecasting Team, CDRI and Directorate General of Budget, Accounting and Statistics, Executive Yuan
B. Coincident indicator series
a. Real GDP index of wholesale and retail-The business cycle started to grow negatively in Q3
This cyclical tendency of this sub-indicator reached its bottom in July 2019, with an index of 99.78. After a year of slow recovery, it reached 101.01 in November 2020. Then it fell all the way down. It was lower than the long-term trend value (100) in May this year, and by October, it had fallen to 98.13. It shows that the business cycle trend stays along the long-term trend horizontal line without significant fluctuations. There has been a significant decline since the second quarter this year, and the growth has been slow to a recession in the third quarter. The actual annual growth rate on the other hand, saw a positive growth from last year to the first half of this year. While the third quarter this year saw a negative growth of 2.79% for the first time.
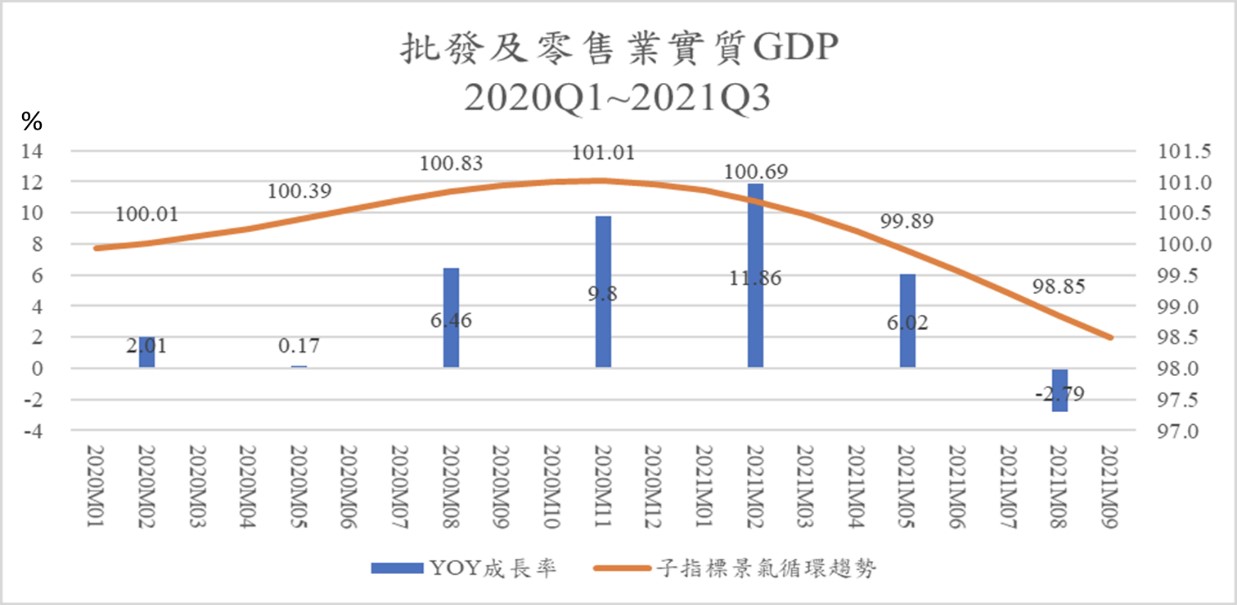
Figure 10. Annual growth rate and cyclical trend of real GDP index of wholesale and retail, 2020Q1~2021Q3
Source: Business Cycle Forecasting Team, CDRI and Directorate General of Budget, Accounting and Statistics, Executive Yuan
b. Real GDP of the accommodation and catering industry-decline since the beginning of this year
The industry has been greatly impacted by the pandemic. The cyclical tendency of this sub-indicator peaked in July 2019 with an index of 102.86, and then fell all the way. It was lower than the long-term value in January this year and had fallen to 90.24 this October. It indicates that the decline of the business cycle has increased significantly since April this year. The actual annual growth rate on the other hand, saw negative growth in every quarter since last year, except for the 8.43% growth in the first quarter this year. There’s a -11.01% in the second quarter and a -26.44% in the third quarter this year.
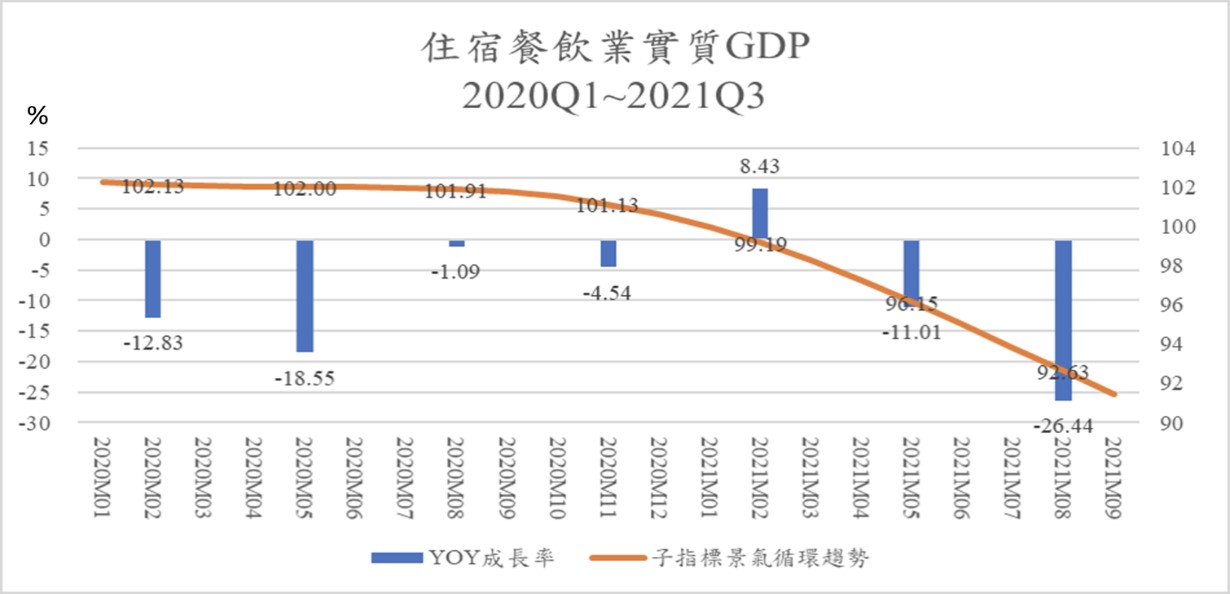
Figure 11. The annual growth rate and circular trend of real GDP in the accommodation and catering industry, 2020Q1~2021Q3
Source: Business Cycle Forecasting Team, CDRI and Directorate General of Budget, Accounting and Statistics, Executive Yuan
c. Real GDP of real estate and residential service industry
The cyclical tendency of this sub-indicator fluctuates slightly over a long period of time. The index peaked last August, with an index of 100.39 and then a slight decline, reaching 99.13 in October this year (estimated). The actual annual growth rate on the other hand, has shown a positive growth since last year. However, it decreased in the second and third quarter this year.
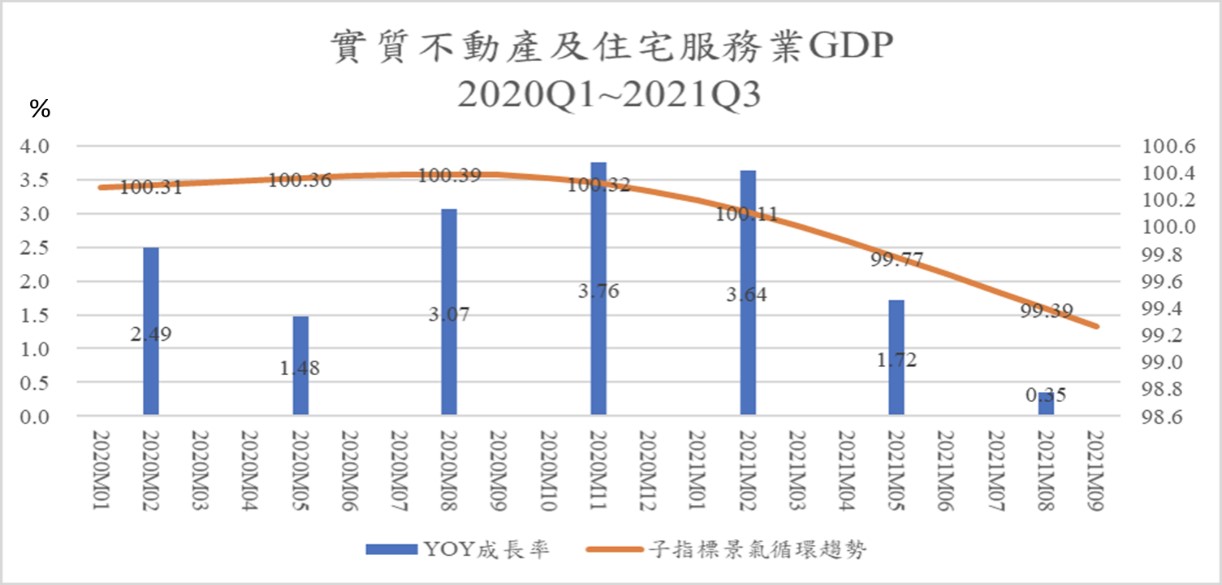
Figure 12. Annual GDP growth rate and cyclical tendency of real estate and residential service industry, 2020Q1~2021Q3
Source: Business Cycle Forecasting Team, CDRI and Directorate General of Budget, Accounting and Statistics, Executive Yuan
d. Residential services, utilities, and other fuel industries-continue to grow slightly
The cyclical tendency of this sub-indicator has a little long-term fluctuation. It reached the bottom in March 2019, with an index of 99.88, and then kept rising slightly all the way, reaching 100.08 in October this year (estimated). The actual annual growth rate on the other hand, has seen a slightly positive growth since 2020. However, it wasn’t higher than 2%.
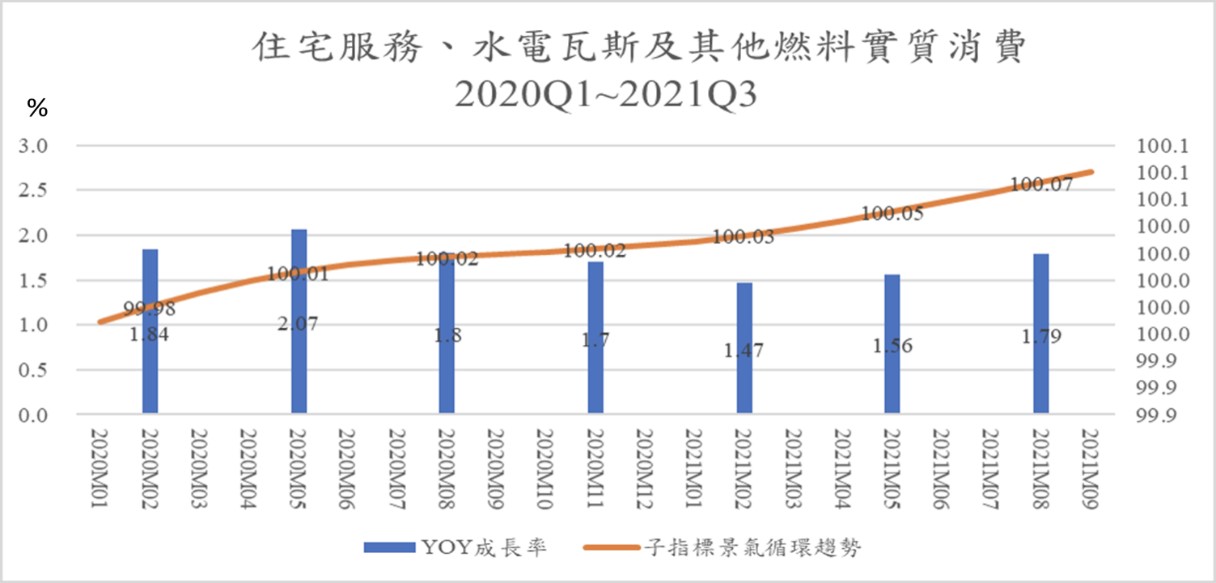
Figure 13. Real consumption of residential services, utilities, and other fuel industries, 2020Q1~2021Q3
Source: Business Cycle Forecasting Team, CDRI and Directorate General of Budget, Accounting and Statistics, Executive Yuan
e. Number of employees in the service industry
The cyclical tendency of this sub-indicator peaked in April last year with an index of 100.24, and then fell all the way to 99.43 this October. It showed a slight decrease, but the rate of decline has increased gradually in Q2 and Q3 this year.
The actual annual growth rate on the other hand, has seen a limited positive growth from last year until this April. Even the growth rate peak hit less than 1%. It started to grow negatively since May this year. The number of employees in the service industry grew negatively in Q2 and Q3 this year. It is obvious that it was affected by the recurrence of the pandemic. Some service industries have reduced demand for labor due to the recession.
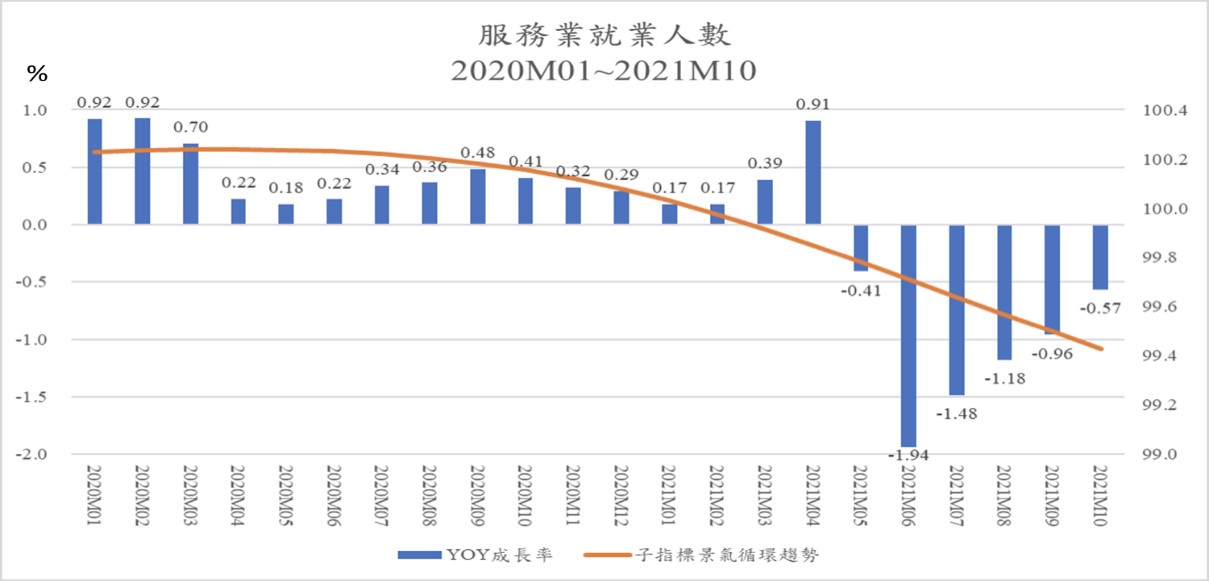
Figure 14. The growth rate and cyclical tendency of the number of employees in the service industry, January 2020 to October 2021
Source: Business Cycle Forecasting Team, CDRI and Directorate General of Budget, Accounting and Statistics, Executive Yuan
C. Lagged indicator series
The lagged indicator includes real consumption of tobacco and alcohol, real consumption of clothing, footwear, and apparel, real consumption of furniture, equipment, and housekeeping, and the number of initial recognition and acceptance of unemployment benefits. The lagged index can be used as a reference for observing whether a business cycle is over. This article omits relevant analysis.
3. Overview of the business cycle and policy implications
- Taiwan’s overall economy is in the recovery phase, but the resurgence of the pandemic has caused uneven recoveries across sectors and industries and the pandemic prevention alert has blocked a certain degree of mobility, resulting in partial decline in the market. The alert has been loosened, along with relief and revitalization measures have begun to take effect. Although the economic cycle of coincident indicators is still in decline, the recovery of leading indicators is vigorous. Thus, if there are no variables such as the pandemic virus variants, there is great hope for a recovery next year.
- Employment in different sectors and industries reflects different results under the pandemic: service trade turned deficit into surplus for the first time; private investment continued to rise, and consumption was relatively sluggish. The manufacturing industry thrives, the information communication and electronics industries dominate the market, yet the service industry goes into recession, the tourism, lodging and catering areas in particular.
- The impact of the pandemic has caused greatest challenges to the network technology and digital technology. In addition to facing the rise of Metaverse’s emerging virtual markets, the government must continue to increase digital economic infrastructure and service provision, as well as assist in the digital transformation of private conventional industries and new digital ventures. It is more appropriate to use a “tailor policy” of precise targets instead of traditional general financial and fiscal policies to face the demand for policy measures against uneven recovery. While facing the high uncertainty and risk of the new variant Omicron, we need to pay close attention to it, and response rapidly with flexibility.
- The huge increase in the inventory changes of private enterprises in the third quarter should be a clear sign of the economy rising.
- The recommendations are as follows:
- Take the broadly effective “alternative mobility” approach instead, and build a cross-industry system integrated intelligent e-commerce platform that can be shared by small and medium-sized enterprises so as to accelerate the development of digital economic infrastructure, and make remote transactions, services and consumption more inclusive and universal become possible
- Precisely formulate “tailor policy” to fully support enterprises and labors in appropriate, timely, and demanding ways.
- As the inflationary spiral pressure is rising, the speculation trend should be closely monitored and be decisive when necessary.
Appendix
Business Cycle Coincident Composite Index for Taiwan Service Sector