Authors: Tain-Tsair Hsu(許添財)Shin-Hsien Chen(陳世憲)
【Abstract】
Since Q2 2022 Taiwan’s business cycle has been trending slower, with both the “Leading Composite Index” and “Coincidental Composite Index” indicators in decline. The GDP data released by the government not only showed that the growth wasn’t as strong as last year, but also showed a new pattern of weaker external demand and relatively strong domestic demand. Although industrial manufacturing is still the main contributor to economic growth, the contribution of the service sector has been relatively high as well.
The cyclical tendency value of the five sub-indicators in the “Coincidental Composite Index” shows a “Retaliatory Recovery” in the “Accommodation and Catering Industry”, and the business cyclical trend of “the Number of Employees in the Service Industry” also rebounded, while “Wholesale and Retail”, “Real Estate and Residential Services” and “Residential Services, and Utilities, and Other Fuel industries” continue to decline.
The cyclical tendency value of the seven sub-indicators in the “Leading Composite Index” shows decline in “Financial and Insurance”, “Stock Price Index of the Commercial Service Industry”, “Net Trade in Services Revenue and Expenditures”, “Private Real Fixed Investment”, and “the Net Entry Rate of Employees in the Commercial Services Industry”, while “Transportation and Storage” and “the Number of the Initial Acceptance of Unemployment Benefits” continue to rise.
Meanwhile, the domestic business cycle has declined due to a slowdown in external demand and a weakening of private investment momentum and national purchasing power. Despite “Revenge Spending” that helped ease the pandemic downturn, there were no significant increase in national purchasing power due to “imported” price increases. Fortunately, the “psychological expectations of inflation” of real estate prices has temporarily subsided. In terms of stable growth, Taiwan still has an international comparative advantage, but the following policy implications should be noted:
1. “Imported” (cost-push) inflation is driven by a shortage of supply and an increase in the cost of imported supplies rather than by an increase in effective demand. If one tries to stabilize prices by unilaterally suppressing demand, it’s easy to fall into the trap of “stagflation” or “recession”. At this time, promoting effective public infrastructure investment and “productive” private investment that can substantially increase productivity can actually reduce the pressure of rising costs due to the “import substitution” effect, and can actually increase domestic supply while narrowing the gap between supply and demand, forming a double positive synergy of economic growth and stability. This is also the reason why CDRI has been calling on Taiwan to implement “comprehensive import substitution” since we found that the world’s economy has faced a “new normal of Shortage Economy”.
2. Taiwan’s economy is being challenged by weak international trade and investment. During the pandemic, the domestic supply chain was unimpeded, and the unique advantages of the chip industry’s competitiveness have created a “moving against the tide” scenario, which is unlikely to be sustainable. To maintain the high level of “economic resilience” that was once the envy of the world, it will have to make changes. Irrespective of government or the private sector, promotion of policies such as R&D investment in the digital service industry, digital transformation, and ESG sustainable transformation are absolutely important tasks that can only be accelerated, rather than neglected.
3. We recommend that the Central Bank’s monetary policies and the government’s financial and fiscal policies should be changed to a more refined and precise “tailor policy” based on the above two points. A new policy that allows limited resources to regain a more appropriate allocation can also lead to the creation of new business opportunities and new markets. Taiwan’s new economic society, which is full of vigor and creativity, is in need of bolder steps towards freedom and openness. Meanwhile, Taiwan has a re-emergence of high international competitiveness and advantages, which is deeply expected.
1. Comprehensive analysis and prediction
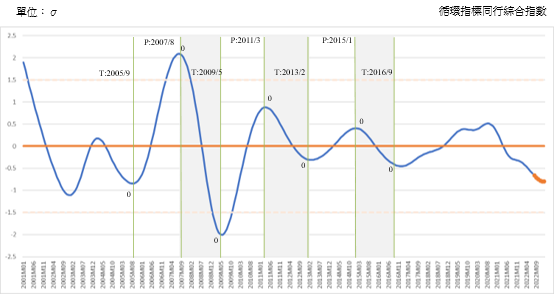
CDRI finds that the Coincidental Cyclical Composite Index for Service Industry (CCCIS) has declined to -0.6148 Standard Deviation in July 2022 and predicts that CCCIS will continue to decline to -0.8004 Standard Deviation by January 2023. (See Figure 1 and the appendix below)
Figure 1. “Tendencies and Forecasts of the Coincidental Cyclical Composite Index for the Service Industry”
Source: Business Cycle Forecasting Team, CDRI
Based on the data provided by the Directorate General of Budget, Accounting and Statistics, Executive Yuan (see Table 2), the GDP growth rate of H1 2022 is 3.38% while the growth contributions of the Industry and Service industries are 2.05% and 1.22% respectively. This shows that Service industry contributions have risen slightly.
With a growth rate of 9.9% and growth contribution rate as high as 2.1%, private investment continued to be the top sector amongst the growth contributions of all sectors (see Table 1). Private consumption is also on the rise with a 1.69% growth rate and 0.78% growth contribution rate. On the other hand, Net Exports have slowed significantly, with a growth rate of only 0.07% and the growth contribution of 0.01%. This is due to the impact of the Russian-Ukrainian war, severe inflation, extreme weather, and geopolitical deterioration on the world economy and trade, and this has begun to affect Taiwan’s foreign trade.
Table 1. Q1 2022 economic growth rate and growth contribution rate, by sector
Unit: Millions of New Taiwan Dollars; %
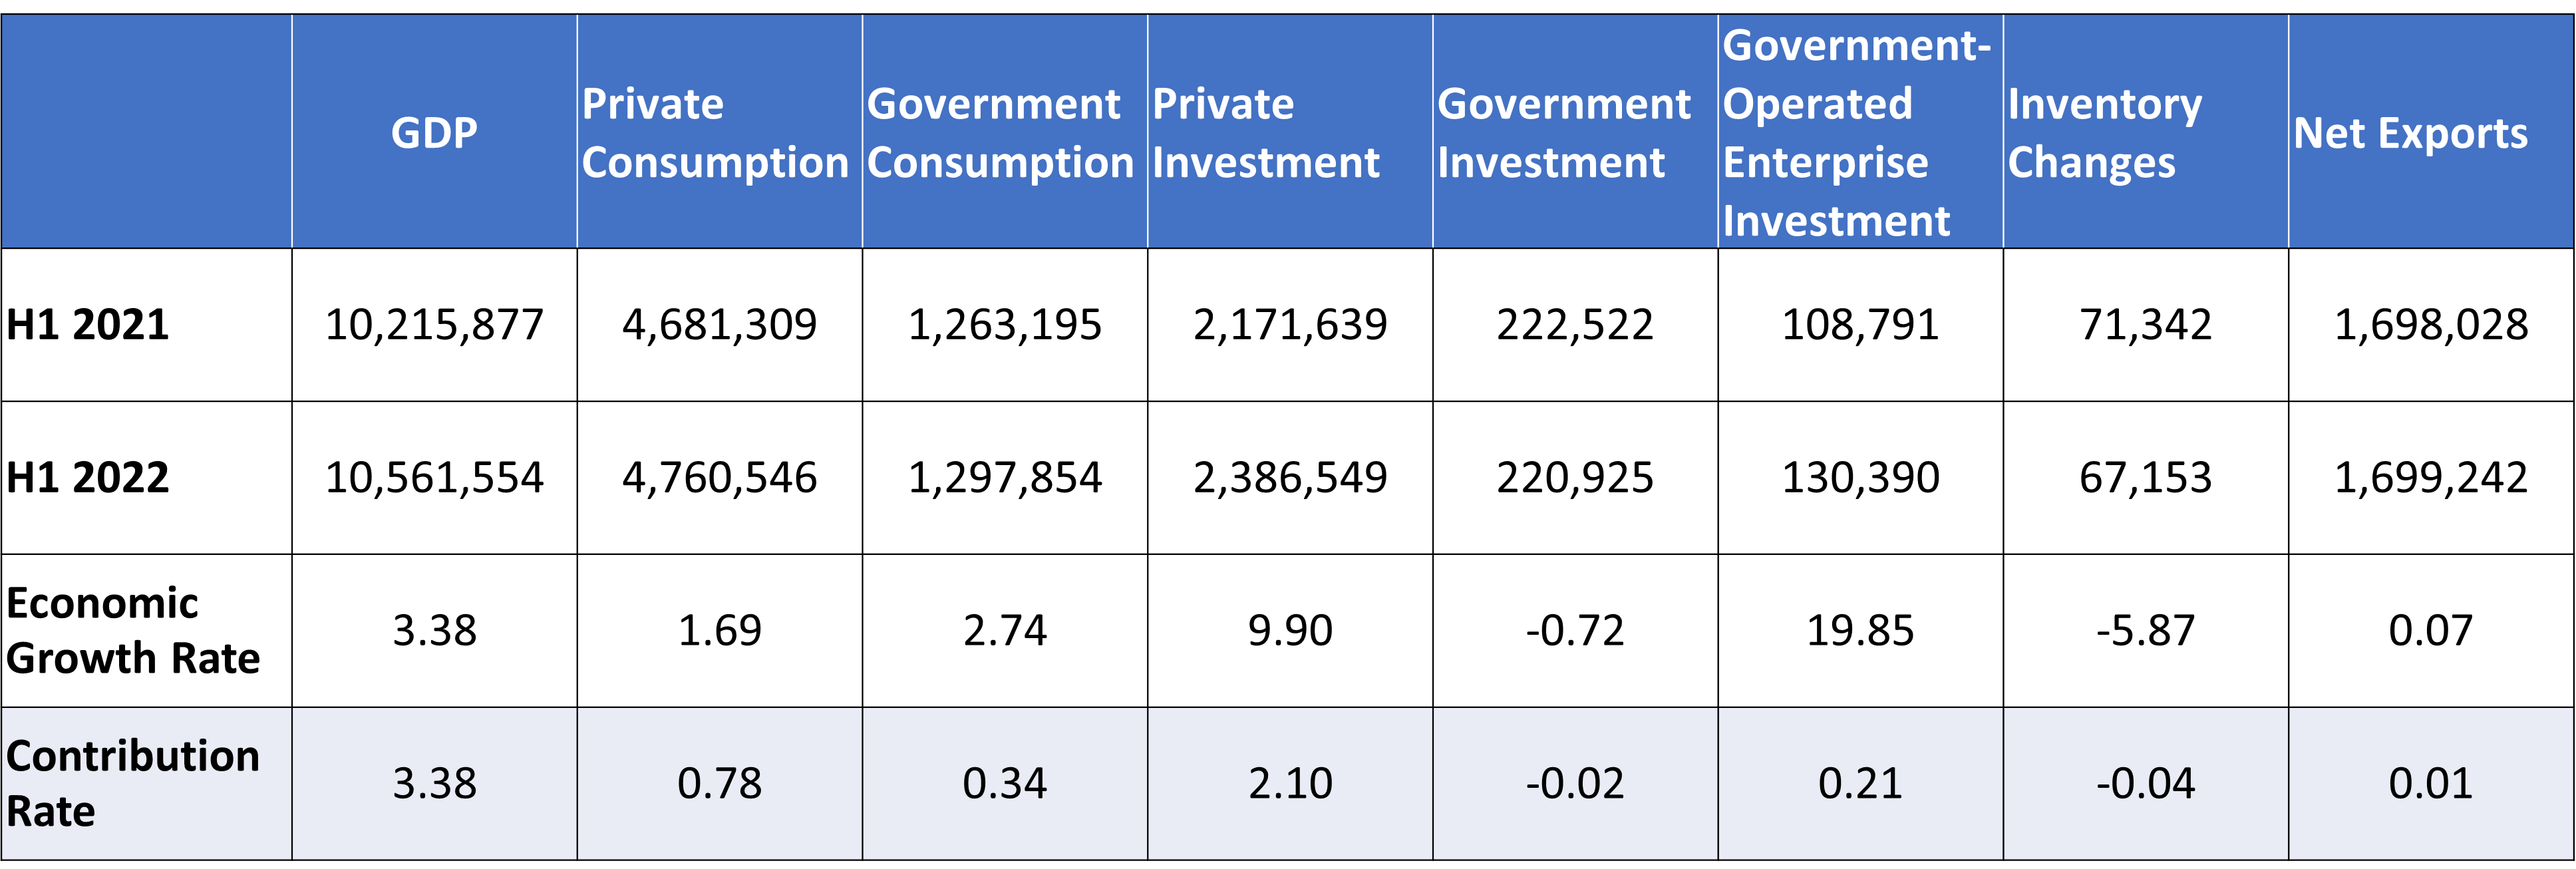
Source: Directorate-General of Budget, Accounting and Statistics, Executive Yuan, and the Business Cycle Forecasting Team of CDRI
Table 2. Q1 2022 economic growth rate and growth contribution rate, by industry
Unit: Millions
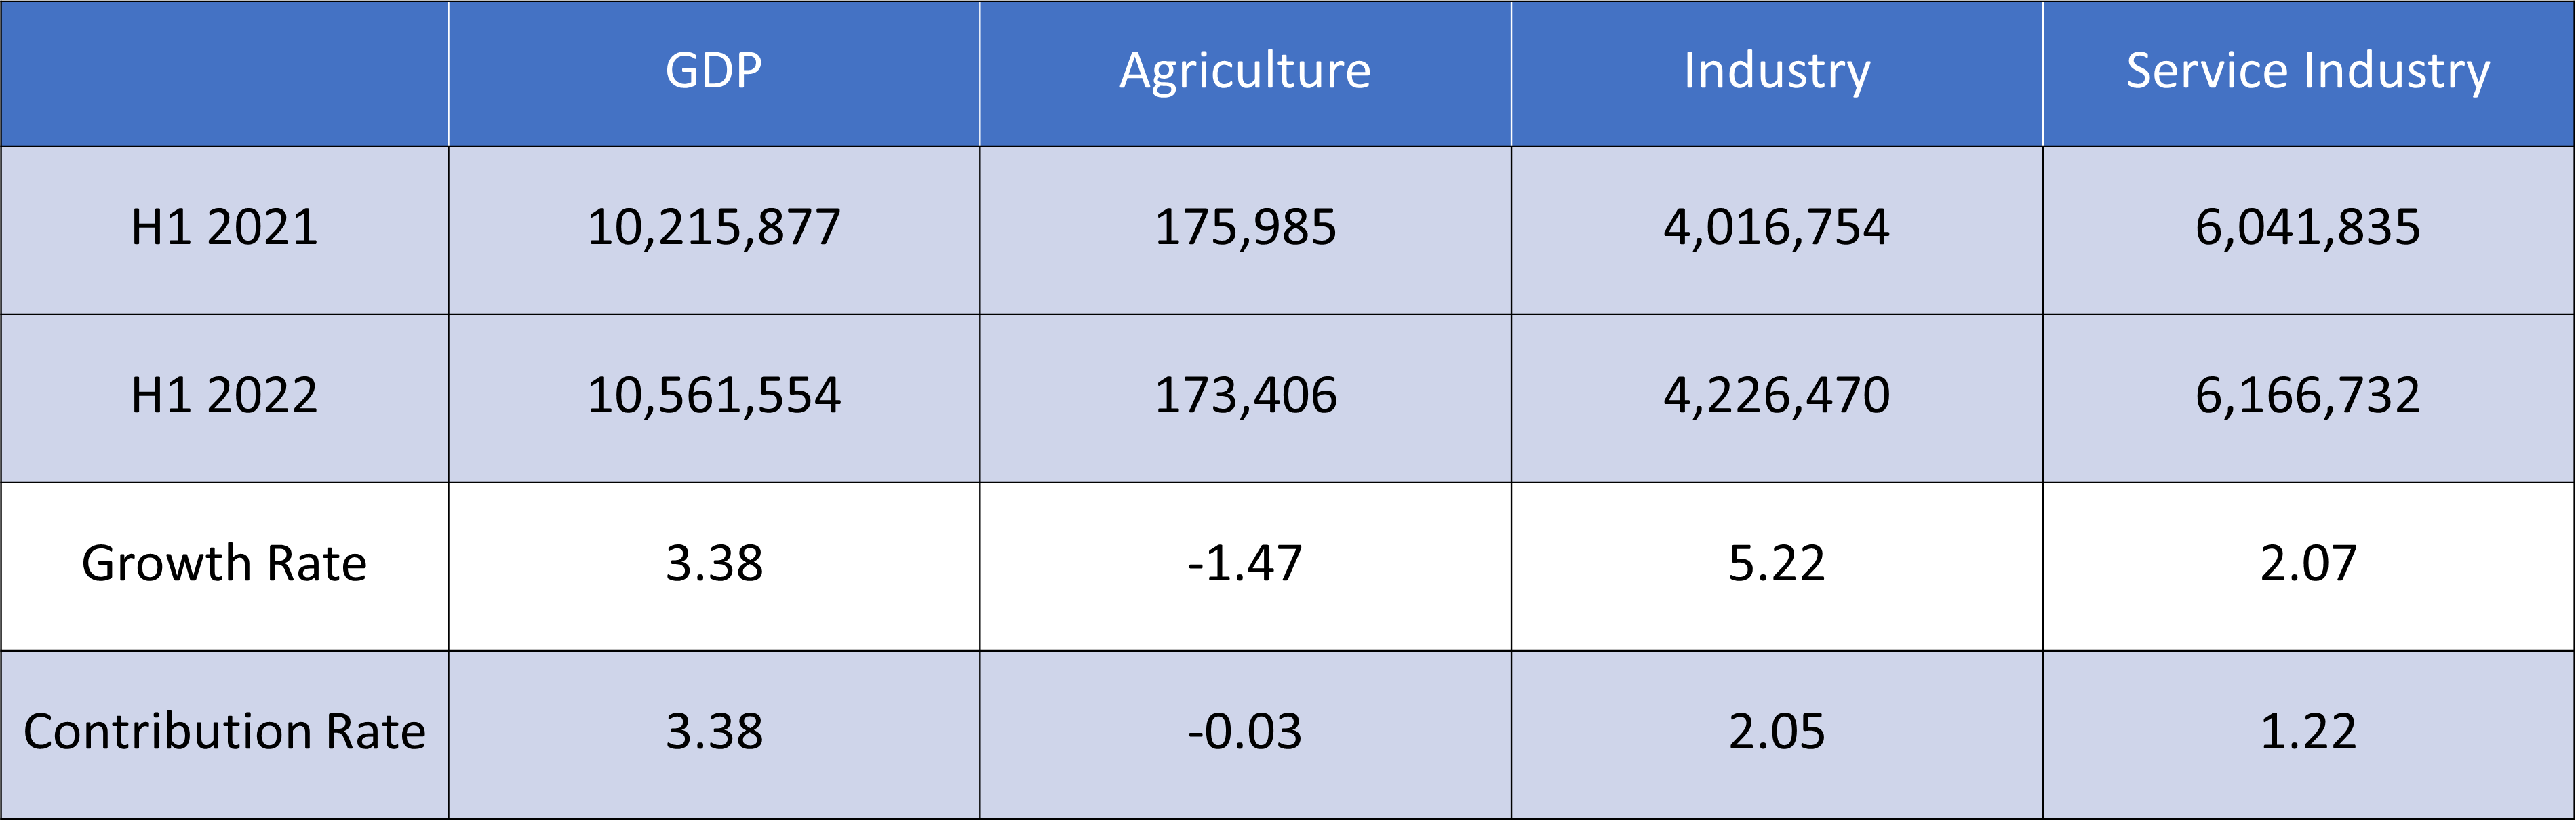
Source: Directorate-General of Budget, Accounting and Statistics, Executive Yuan, and the Business Cycle Forecasting Team of CDRI
A cross-examination of sectors and industries reveals that private enterprises have been prospering in Investment, Manufacturing, and Domestic Demand, while stagnant Net Exports is still relatively sluggish, resulting in continually serious imbalances.
2. Service industry business cycle outlook
【Regarding the indicator system】
The business cycle Composite Index system on the Time Series Analysis. We analyze the relevant economic indicators in the time series and select indicators based on their significance to the business cycle and stability of their cyclicality. They are then classified into leading indicators, coincident indicators and lagged indicators through the use of statistical analysis and verification.
The cyclical trend of the Composite Index of coincident indicators is shown to be highly correlated with the cyclical trend of the GDP, and the forecast value of the Composite Index of the coincident indicators, estimated by the Leading Indicator Composite Index, could be used to forecast the moving trends of the GDP.
The cyclical trend of economic indicators fluctuates around the long-term trend. The long-term trend value is normalized to 100; cyclical trend values greater than 100 indicate a recovery or prosperity stage while values below 100 indicate a recession or depression stage.
The standardized changes of the indicators’ cyclical trend values (in Standard Deviation units) are added up to become a Composite Index, and it fluctuates around the long-term trend value with a Standard Deviation of zero.
【Latest Indicator Trends】
The Leading and Coincidental Composite Indices Curve for this business cycle’s indicator system is shown in Figure 2.
Leading Cyclical Composite Index (LCCIS) has bottom out in June 2020 and has risen for 19 months until January of this year (2022). However, it started to decline from February, due to sudden changes to the international situation of H1 this year. Its indices changed from -0.6288 Standard Deviation in June 2020 to 0.0679 Standard Deviation in May 2021 and further reached to 0.4218 Standard Deviation by January of this year. From then on, it declined to 0.3 Standard Deviation in July.
Looking at the diffusion situations of the leading indicators, 5 out of 7 sub-indicators fell.
The CCCIS has been directly affected by the pandemic, having fallen from its peak of 0.5105 Standard Deviations, in August 2020 to -0.0732 Standard Deviation in May 2021. It then fell to -0.3501 Standard Deviation in January this year and continued to decline to -0.6148 Standard Deviation by July. If the trend continues, it is expected to decline to -0.8004 Standard Deviation by January 2023 (See Figure 1 above and the attached appendix.)
Looking at the diffusion situations of the coincident indicators, 3 out of the 5 sub-indicators keep declining.
Since the latest business trend in Q2 this year, it appears that regardless of the leading or coincidental composite index, whether the Composite Index or the Diffusion Index, there is a downward trend in prosperity.
Figure 2. Leading and Coincidental Cyclical Composite Index for the Service Industry
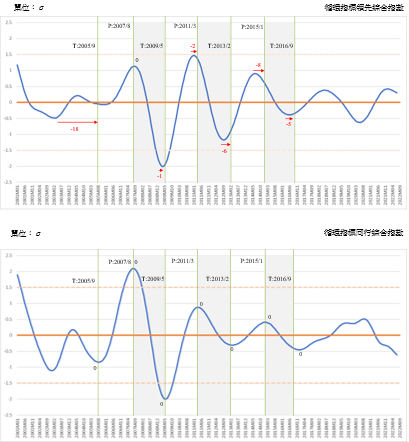
Source: Business Cycle Forecasting Team, CDRI
A. Leading indicator series
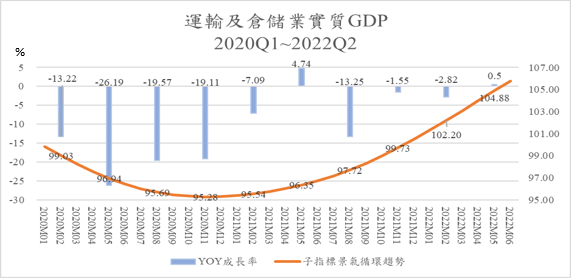
a. Business cycle trend of real GDP of the Transportation and Storage Industry has slightly recovered.
The cyclical tendency value of this sub-indicator reached a low of 95.28 in November 2020, and then rose to 100.52 in December last year. It then accelerated to 105.78 by June this year and 106.68 in July (extrapolated). The value has been accelerating since H2 last year.
However, the annual growth rate (YOY), calculated based on its actual value, has still been in negative growth in each quarter since 2020, only once being positive at 4.74% during Q2 last year (2021). It decreased 13.25% in Q3 and slowed down in Q4 at 1.55%. It then declined to 2.2% in Q1 this year, but rose to 0.5% in Q2, indicating that the Transportation and Storage Industry is slightly recovering.
Figure 3. The annual growth rate of Transportation and Storage GDP and business cycle trend, 2020Q1~2022Q2
Source: Business Cycle Forecasting Team, CDRI and Directorate General of Budget, Accounting and Statistics, Executive Yuan
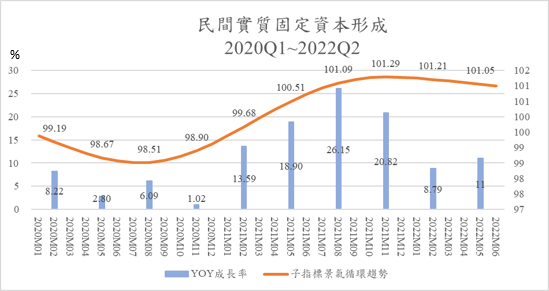
b. Private Real Fixed Capital Formation has weakened, but it is still at the top of the GDP growth momentum.
The cyclical tendency value of this sub-indicator reached its lowest point of 98.51, in July 2020, and then exceeded the long-term trend value of 100 in April last year. It then reached its peak, 101.29, in November last year and started to fall. It was 101 in June this year (2022) and 100.95 (the extrapolated value) in July, showing that it had even surpassed the stagnation periods in Q4 2019 and H1 2020.
The annual growth rate (YOY) has been in positive growth in each quarter since 2020. Specifically, the four quarters of 2021 have increased to 13.59%, 18.9%, 26.15% and 20.82% respectively, and 8.79% and 11% for Q1 and Q2 this year (2022).
Figure 4. Annual growth rate and cyclical trend of Private Real Fixed Capital formation, 2020Q1~2022Q2
Source: Business Cycle Forecasting Team, CDRI and Directorate General of Budget, Accounting and Statistics, Executive Yuan
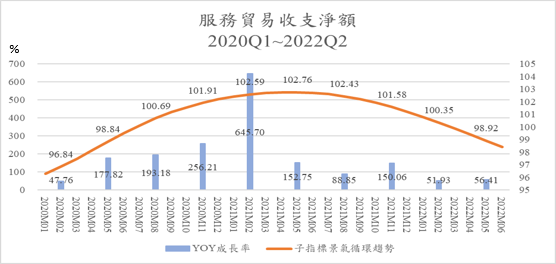
c. Net trade balance in Services Revenue and Expenditure shows that the cyclical tendency value has been exceeding its long-term trend value for a long time, however the cyclical trend has slowed down after surpassing the long-term trend value.
The cyclical tendency of this sub-indicator reached its lowest at 95.26, in September 2019, and then has been rising ever since, reaching the long-term trend level in July 2020 with an index of 100.14. It reached the peak in May 2021 with an index of 102.76, and slightly dropped. It started to fall below the long-term trend value in February this year (2022), reaching 98.43 in June and 97.94 in July 2022 (extrapolated).
Taiwan’s service trade, which had suffered a long-term deficit, had a great improvement in net services trade balance since the global pandemic inhibited international tourism in 2020, and then surprisingly turned into a trade surplus in Q2 2020. The growth rate (YOY) of the net trade balance in Services Revenue and Expenditure in Q1 last year reached its historical high of 645.7% but dropped to 152.75% in Q2 and 88.85% in Q3, before rebounding to 150.06% in Q4. It reached 51.93% and 56.41 in Q1 and Q2 this year (2022) respectively. This shows that the improving path for the Services Revenue and Expenditure has slowed down since Q2 last year.
Figure 5. Annual growth rate and cyclical trend of net trade in Services Revenue and Expenditure, 2020Q1~2022Q1
Source: Business Cycle Forecasting Team, CDRI and Directorate General of Budget, Accounting and Statistics, Executive Yuan
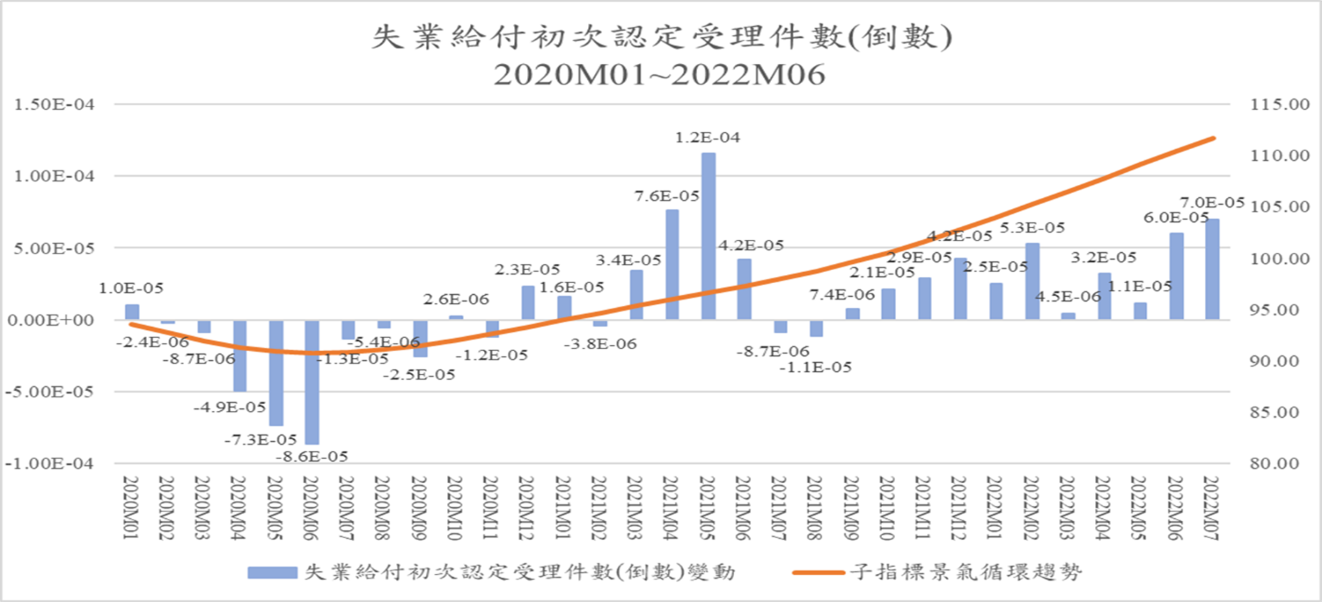
d. Initial Acceptance of Unemployment Benefits (inverted) shows that unemployment pressure is alleviating.
The cyclical tendency of this sub-indicator reached its lowest value of 90.78 in June 2020, and then rose all the way to 100 in October 2021, and 111.72 in July this year. This indicates that the employment demand rapidly increases due to the large amounts of investment from the return of Taiwanese businessmen. Therefore, the number of people applying for unemployment benefits for the first time, a leading indicator to the unemployment rate, has dropped significantly. This should basically be an indicator of the overall economy, but it is does is not necessary indicatively of any phenomena in the service industry. When compared with the Net Entry Rate of Employees in the commercial service industry below, with the business cycle index exceeding the long-term trend value in July last year, it shows that the leading indicators of employment in the service industry has indeed been improving significantly.
Figure 6. Number of the initial acceptance of unemployment benefits (inverted) and the annual growth rate and cyclical trend January 2020 to April 2022
Source: Business Cycle Forecasting Team, CDRI and Directorate General of Budget, Accounting and Statistics, Executive Yuan
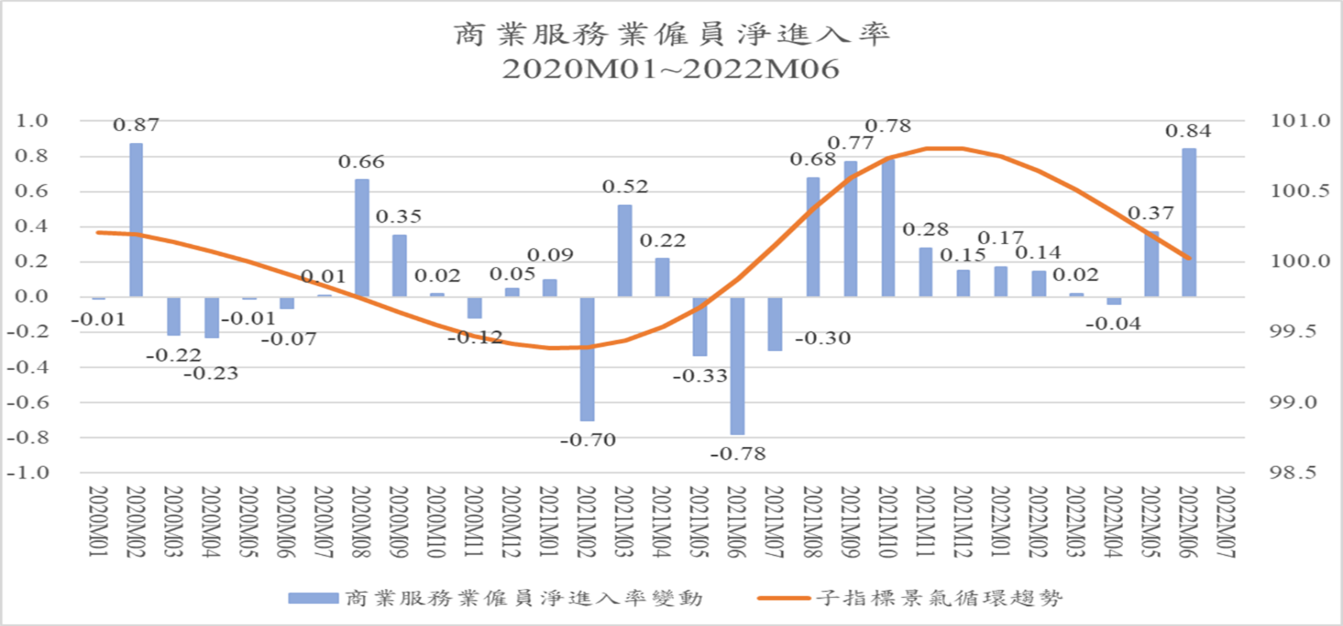
e. Net Entry Rate of Employees in the commercial services industry-the business cycle trend that crosses the long-term trend value will lead to employment improvement.
The cyclical tendency of this sub-indicator reached its peak of 100.21, and then declined to 99.39 in January 2021. It then reached 100.81 in November 2021 and fell to 99.85 in July 2022. This shows that employment demand in the Service industry has been severely impacted by the pandemic in 2020, contrary to the boom in the manufacturing industry. Meanwhile, the changes in the actual value of this indicator during this period also showed a downward trend (Figure 7.)
Figure 7. Annual changes and cyclical trends in the net entry rate of employees in the commercial service industry, January 2020 to June 2022
Source: Business Cycle Forecasting Team, CDRI and Directorate General of Budget, Accounting and Statistics, Executive Yuan
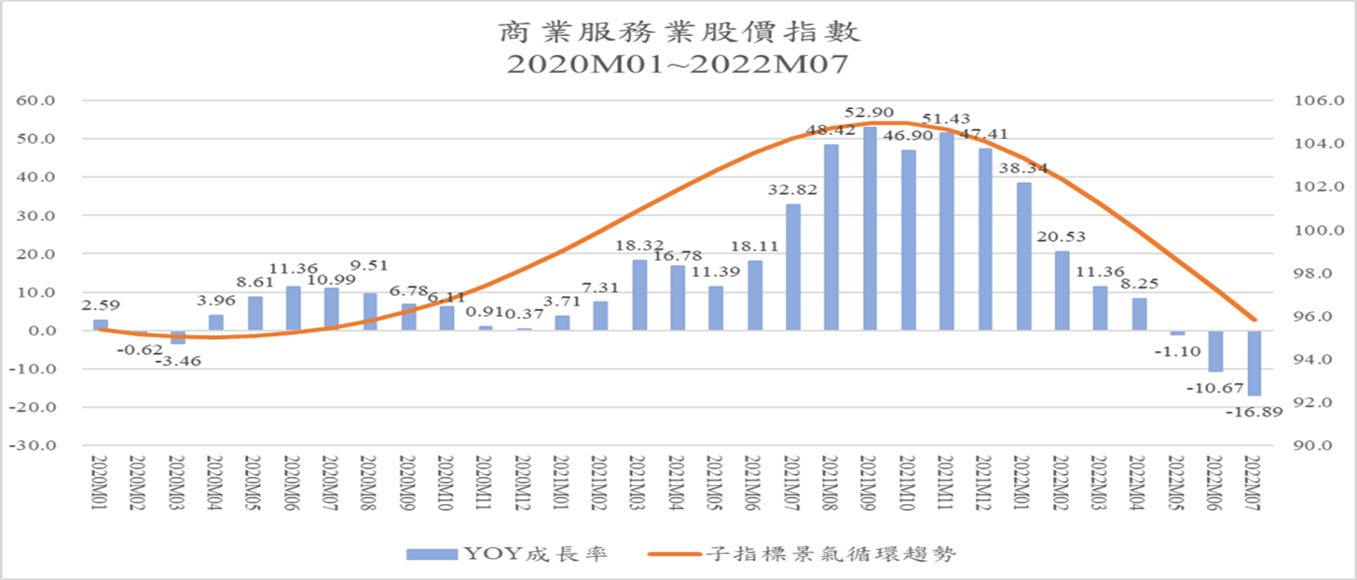
f. Stock Price Index of the commercial services sector.
The cyclical tendency of this sub-indicator reached its lowest of 95.02 in April 2020, and then kept rising, exceeding the long-term trend level in March last year, and reached peak by September last year with an index value of 104.97, before starting to decline. It then fell below the long-term trend value in April this year, and in July, the value has declined to 95.82. This reflects the prosperity of Taiwan’s general stock market over the past year. In line with the changes in the way of life, work, and transactions due to the pandemic, the development of digital and intelligent production and sales has been accelerated, which is more conducive to the investment and development of the business service industry, and in turn makes the stock market outlook for related business service industries optimistic. Along with the changes in the international economic situation, the exchange rate market and international capital outflows, the stock market is no longer in trouble.
An indicator is the annual growth rate of the actual Stock Price Index. It has seen double-digit growth since March last year and even reached 32.82% and 48.42% in July and August, respectively. In September and October, the growth rate came to 52.9% and 46.9%, and 51.43% and 47.41% in November and December. However, it then declined ever since, with negative growth since May 2022, and a growth rate of -10.67% and -16.89% in June and July respectively.
Figure 8. The annual growth rate and circular trend of the Stock Price Index of the commercial service industry, January 2020 to July 2022
Source: Business Cycle Forecasting Team, CDRI and Directorate General of Budget, Accounting and Statistics, Executive Yuan
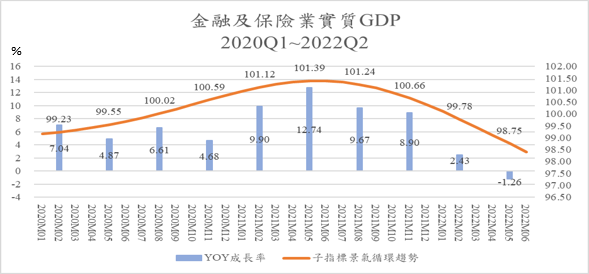
g. Cyclical trend of Real GDP of Finance and Insurance Sector recovery facing setbacks
The cyclical tendency of this sub-indicator got out of the trough by the end of 2020 and began to exceed the long-term trend value (100) at 100.02 in August 2020, and continued to rise slightly, reaching the peak with 100.39 in May 2021, and then slightly decreased afterwards. It fell below the long-term trend value in February this year (2022), and decreased to 98.4 in June, and even reached 98.05 (the extrapolated value) in July, indicating that the prosperity of the industry is declining.
The annual growth rate (YOY), calculated based on its actual value, has been in positive growth since 2020. The growth rate in each quarter last year were: 9.9%, 12.74%, 9.67% and 8.9%, respectively. However, it dropped to 2.43% and -1.26% in Q1 and Q2 this year.
Figure 9. Annual growth rate and cyclical trend of real GDP of Finance and Insurance Sector, 2020Q1~2022Q1
Source: Business Cycle Forecasting Team, CDRI and Directorate General of Budget, Accounting and Statistics, Executive Yuan
B. Coincident indicator series
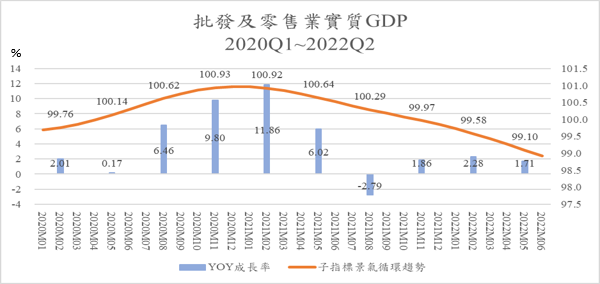
a. The business cycle trend of real GDP Index of Wholesale and Retail is slightly down.
The cyclical tendency of this sub-indicator reached its bottom in October 2019, with an index value of 99.63. After a year of slow recovery, it reached its peak of 100.97 in December 2020, then it continually fell. It was lower than the long-term trend value (100) in November last year and dropped to 99.85 in December. It dropped to 98.93 in June this year, and 98.75 in July (the extrapolated value). It shows that although there are no significant fluctuations alongside the long-term trend value yet, there has been an apparent decline since Q2 last year (2021).
Meanwhile, the actual annual growth has shown growth from 2020 to H1 last year (2021), although in Q3 last year it had a negative growth of 2.79% for the first time before slightly returning to a positive growth. However, the growth is weak, showing that the physical market for the booming retail e-commerce is sluggish.
Figure 10. Annual growth rate and cyclical trend of real GDP Index of Wholesale and Retail, 2020Q1~2022Q2
Source: Business Cycle Forecasting Team, CDRI and Directorate General of Budget, Accounting and Statistics, Executive Yuan
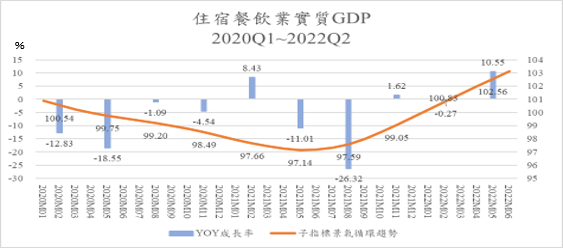
b. Real GDP of the Accommodation and Catering Industry shows a “revenge” growth.
The industry has been greatly impacted by the pandemic with the cyclical tendency of this sub-indicator peaking in May 2019 at 102.99, and then falling ever since. It was lower than the long-term value in April 2020 and reach its trough with 97.15 in May last year, before rising. It reached 103.13 in June this year (2022), 103.69 in July (the extrapolated value). Meanwhile, the annual growth rate reached 10.55% in Q2 this year.
Figure 11. The annual growth rate and circular trend of real GDP in the Accommodation and Catering Industry, 2020Q1~2022Q1
Source: Business Cycle Forecasting Team, CDRI and Directorate General of Budget, Accounting and Statistics, Executive Yuan
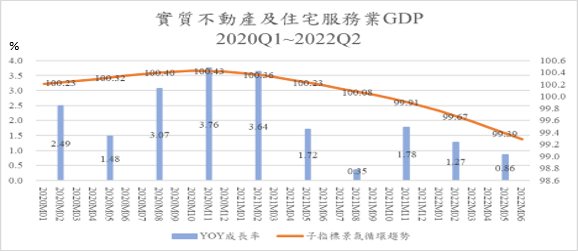
c. Real GDP of Real Estate and Residential Service Industry-business cycle trend grow slightly.
The cyclical tendency of this sub-indicator fluctuates slightly over the long-term. The index peaked in October 2020, with a value of 100.43 and then showed a series of slight declines. It was higher than the long-term trend until October 2021 and continued to decline since. It reached 99.28 in June this year, and 99.19 in July (extrapolated value.)
The actual annual growth rate has shown a continuing growth, however, it has slowed down since Q2 last year.
Figure 12. Annual GDP growth rate and cyclical tendency of Real Estate and Residential Service Industry, 2020Q1~2022Q1
Source: Business Cycle Forecasting Team, CDRI and Directorate General of Budget, Accounting and Statistics, Executive Yuan
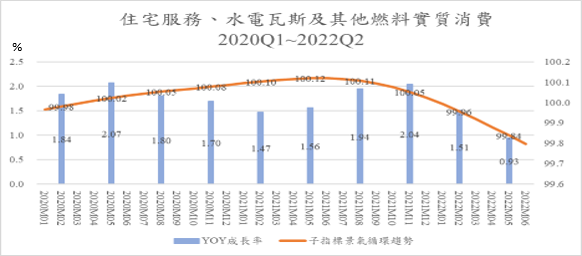
d. Residential Services, Utilities, and Other Fuel Industries-continues to grow slightly while the business cycle trend declines slightly.
The cyclical tendency of this sub-indicator showed little long-term fluctuation. It reached the bottom in March 2019, with an value of 99.87, and then kept rising slightly before reaching its peak of 100.12 in June last year (2021). It then slightly declined until June this year at 99.8 and reached 99.76 in July this year (extrapolated).
Meanwhile, the actual annual growth rate has seen a slightly positive growth since 2020. However, it was never higher than 2%, even dropping to 0.93% in Q2 this year.
Figure 13. Real Consumption of Residential Services, Utilities, and Other Fuel Industries, 2020Q1~2022Q4
Source: Business Cycle Forecasting Team, CDRI and Directorate General of Budget, Accounting and Statistics, Executive Yuan
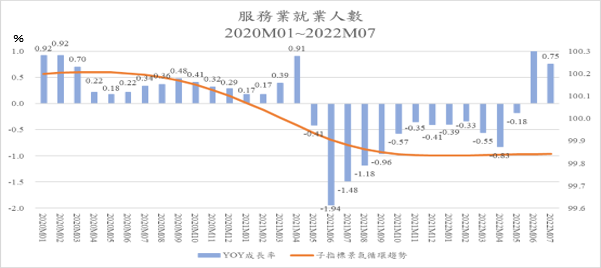
e. Number of employees in the service industry-affected by the downward trend but has slightly increased since this year.
The cyclical tendency of this sub-indicator peaked in April 2020 with an index of 100.21, and then fell below the long-term tendency value at 99.97 in April 2021. It had only showed a slight decrease, with the decline slowing down gradually. It reached its trough in January this year, with 99.84.
The actual annual growth rate has seen a limited growth from last year until this April. The growth rate peak never hit a high of 1% and it started to grow negatively from May 2021, especially in Q2 and Q3 last year. This was due to the recurrence of the pandemic, which has reduced demand for labor due to the recession. The growth rate then reached 1% and 0.75% in Q1 and Q2 this year respectively.
Figure 14. The growth rate and cyclical tendency of The Number of Employees in the Service Industry, January 2020 to April 2022
Source: Business Cycle Forecasting Team, CDRI and Directorate General of Budget, Accounting and Statistics, Executive Yuan
C. Lagged indicator series
The lagged indicator includes Real Consumption of Tobacco and Alcohol, Real Consumption of Clothing, Footwear, and Apparel, Real Consumption of Furniture, Equipment, and Housekeeping, and theNumber of Initial Recognition and Acceptance of Unemployment Benefits. The Lagged Index can be used as a reference for observing whether a business cycle is over. This article omits relevant analysis.
Appendix
Business Cycle Coincident Composite Index for Taiwan Service Sector
|
Year/Month
|
Deviation of Standardized Cyclical Coincident Composite Index
(Unit: σ, Benchmark: 0)
|
Remark
|
|
2023-01
|
-0.8044
|
(P)
|
Use ARMA Model: (4,0)(0,0) to make predictions based on the leading effect set for half year
|
|
2022-12
|
-0.7955
|
(P)
|
|
2022-11
|
-0.7770
|
(P)
|
|
2022-10
|
-0.7473
|
(P)
|
|
2022-09
|
-0.7086
|
(P)
|
|
2022-08
|
-0.6637
|
(P)
|
|
2022-07
|
-0.6148
|
(f)
|
The estimated value of the Coincident Composite Index
|
|
2022-06
|
-0.5644
|
(a)
|
The actual value of the Coincident Composite Index
|
|
2022-05
|
-0.5140
|
(a)
|
|
2022-04
|
-0.4649
|
(a)
|
|
Source: Business Cycle Forecasting Team, CDRI
Note: (a): actual; (f): estimated; (p): predicted
|