Authors: Tain-Tsair Hsu(許添財), Shin-Hsien Chen(陳世憲)
【Abstract】
Over-pessimism shouldn’t be affecting the courage to move forward and miss the opportunity for transformation.
The Coincidental Cyclical Composite Index for Service Industry (CCCIS) in Q4 2022 continued to rebound from Q3 and is predicted to continue to rise in July this year (2023), mainly because that the “Accommodation and Catering Industry” and “The Number of Employees in the Service Industry” lead other coincident sub-indicators, bottomed out obviously since July 2021 and November 2021 respectively. Their standardized trend values have also risen from the troughs of -2.68 and -1.28 Standard Deviations to +4.14 and +0.43 Standard Deviations in January 2023, respectively.
However, the other three coincident sub-indicators continue to decline. Based on their standardized cyclical trend values, the three sub-indicators “Wholesale and Retail”, “Real Estate and Residential Service Industry”, and “Real Consumption of Residential Services, Utilities, and Other Fuel Industries” are still stuck in the abyss of -3.01, -1.52, and -1.26 Standard Deviations, respectively. Moreover, the Leading Cyclical Composite Index (LCCIS) has been declining since its peak in November 2021 and has dropped to -1.28 Standard Deviations in January this year (2023). Only the two sub-indicators in the coincident indicators and one sub-indicator among the leading indicators- “Transportation and Storage” showing rebounded would certainly not enough for us to confirm that the overall economic situation has recovered already.
Looking at the global economic situation, regardless of whether one holds a pessimistic or optimistic perspective, we are undoubtedly mired in the fog of persistent inflation, stagflation, and debt crises. Taiwan as an export-oriented economy also saw a negative contribution of -0.72% from Net Exports to its economic growth rate in 2022. Recently, the so-called “Dr. Doom”, Nouriel Roubini, representing the extreme pessimistic camp, has warned that a “perfect storm” is brewing. His book, “MegaThreats,” identifies “ten major dangerous trends that threaten our future economy” and provides data that is both extensive and profound, making it hard to ignore, especially given that he accurately predicted the global financial crisis in 2008.
However, from the perspective of business cycle theory, historically, economic “crises” have merely occurred during periods of synchronous declines in various cycles of different lengths, including the shortest Kitchin Cycle, the longer Juglar Cycle, much longer construction cycle, the even longer Kuznets Cycle, and the longest Kondratieff wave. Take the Global Financial Crisis in 2008 for example, the Kondratieff long-wave business cycle index had a downward turning point in 2000. Based on the experience of the Great Depression in the 1930s and the Stagflation Crisis of the 1970s caused by the oil crisis, it can be inferred that a major economic crisis will occur six to nine years after the downward turning point appears. (For instance, economist Anwar Shaikh also predicted in 2003 that a major economic crisis would occur between 2007 and 2009.)
Although the current economic difficulties are truly disturbing, they shouldn’t prevent us from understanding that “economic globalization” after the oil crisis has enabled multinational corporations to resume the possibility for their profits and accumulation. However, it didn’t actually improve the growth of long-term productivity. The life cycle of the globalization system has come to an end, and various kinds of uncertainty have emerged too, which is the current economic fog we’re facing. Fortunately, there have been three productivity revolutions (business, industrial, and energy) that can ensure a restoration of long-term productivity growth, while digital transformation and ESG sustainable transformation are the fundamental solutions. In short, we have no reason to be overly pessimistic and lose the courage to move forward, let alone miss the opportunity to transform. Upon closer examination, every current economic fluctuation are accompanied by rapid changes in consumer behavior, employment behavior, and market structures such as goods, services, and labor, which have almost become the “new normal.”
1. Comprehensive analysis and prediction
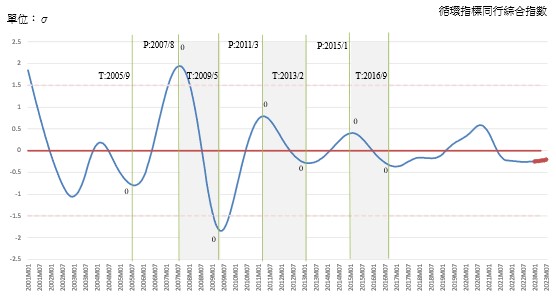
CDRI finds that the Coincidental Cyclical Composite Index for Service Industry (CCCIS) has bottom out in July 2022 of -0.2591 Standard Deviation. However, it’s predicted that the index will continue to rebound and reach -0.2067 Standard Deviation by July 2023. (See Figure 1 and the appendix below)
Figure 1. “Tendencies and Forecasts of the Coincidental Cyclical Composite Index for the Service Industry”
Source: Business Cycle Forecasting Team, CDRI
Based on the data provided by the Directorate General of Budget, Accounting and Statistics, Executive Yuan, the economic growth rate last year (2022) has shrunk to 2.45%. Private Investment, which had the weakest contribution to growth in the past, turned positive and its contribution to growth increased to 1.6% surpassing Private Investment’s 1.4%. On the other hand, the growth rate of Net Exports was negative, and its contribution to growth showed a negative 0.72%. With a pessimistic economic outlook and rising costs, inventory investment was significantly reduced by 79.18%, and its contribution to growth was negative 0.52%. The momentum of economic growth has shifted from External Demand to Domestic Demand, which is a clear trend. Export has always been the engine of Taiwan’s economic growth, but the impact of international market turbulence and weak demand on Taiwan’s economy can’t be underestimated. (See Table 2 below.)
From the perspective of industry, the growth rate contribution in 2022 has also undergone major changes. The growth contribution of the Service Industry has become greater than that of the Industry, 1.44% and 0.78 % respectively.
Table 2. 2022 economic growth rate and growth contribution rate, by sector
Unit: Millions of New Taiwan Dollars; %
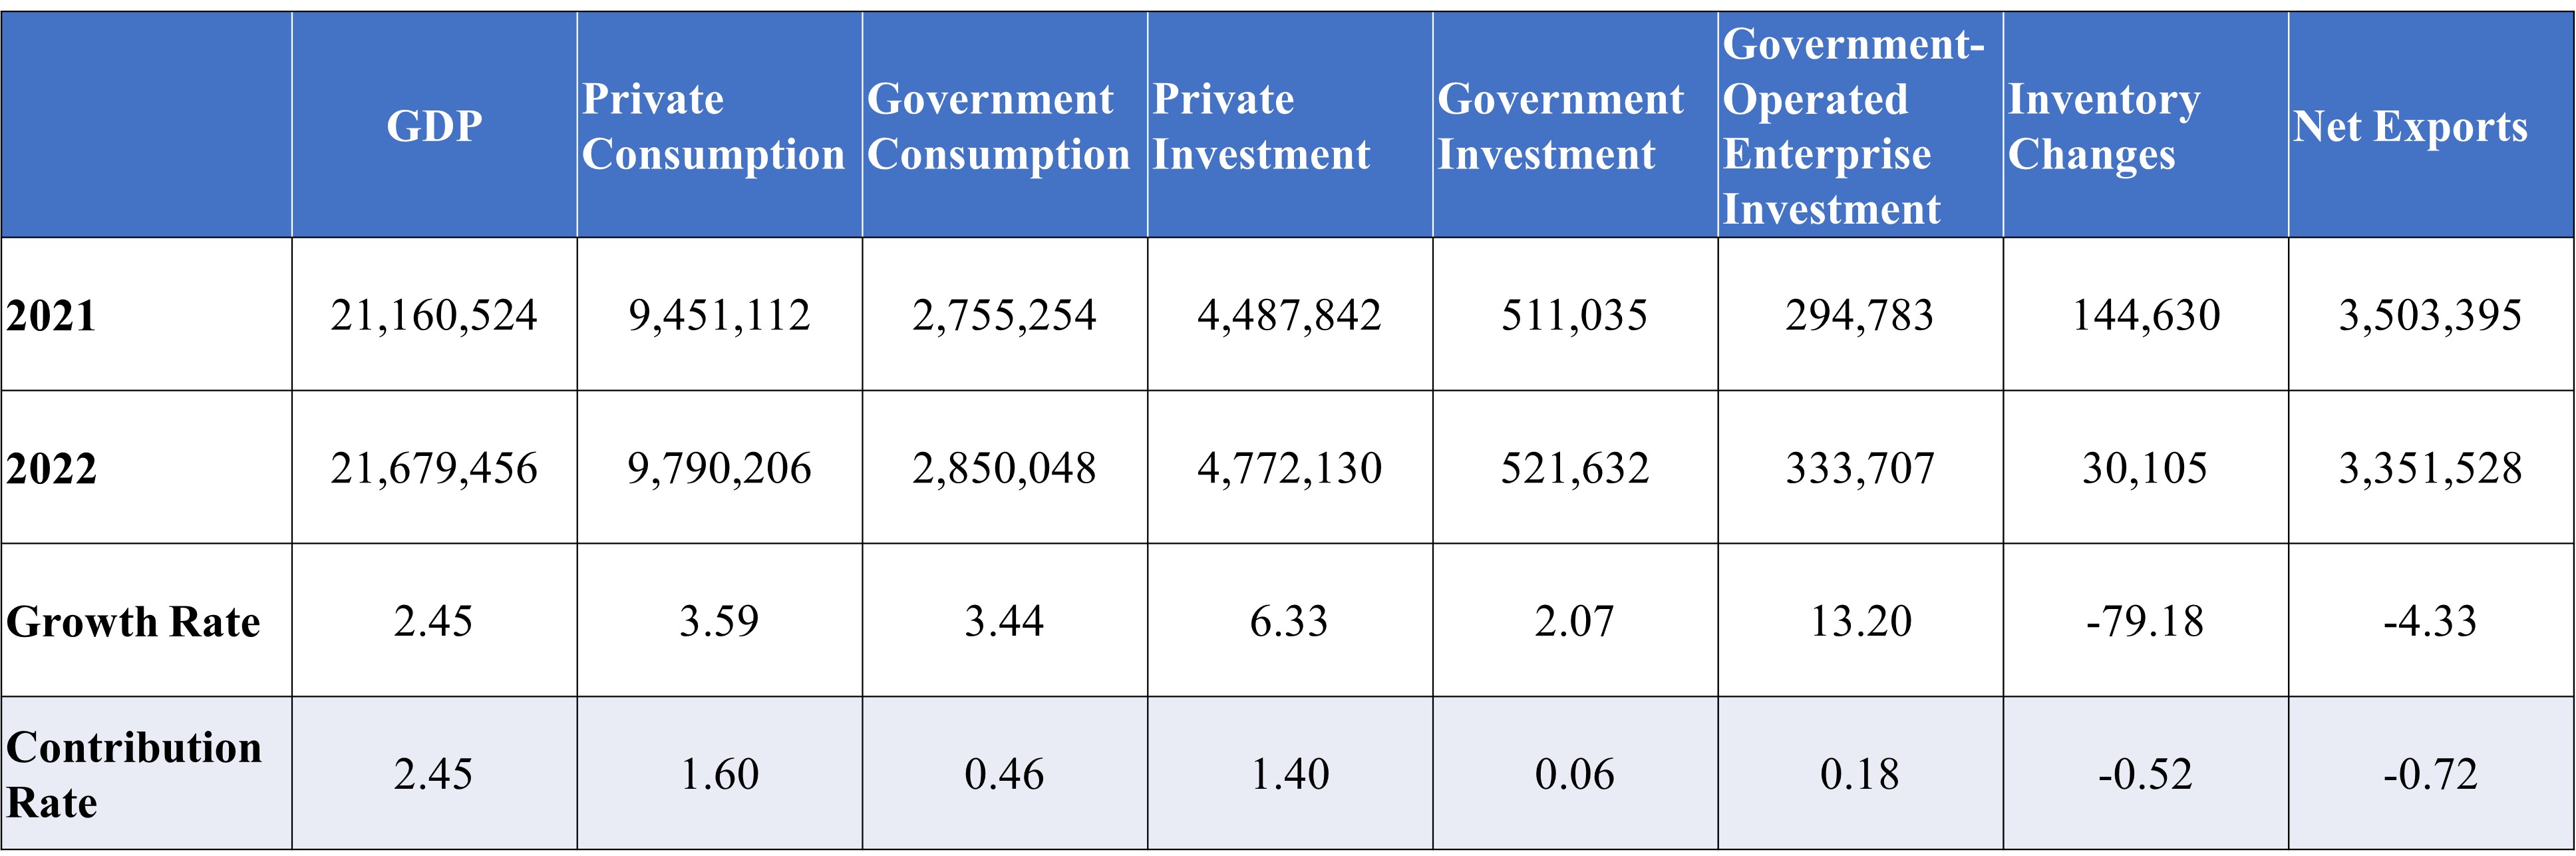
Source: Directorate-General of Budget, Accounting and Statistics, Executive Yuan, and the Business Cycle Forecasting Team of CDRI
Table 3. 2022 economic growth rate and growth contribution rate, by industry
Unit: Millions
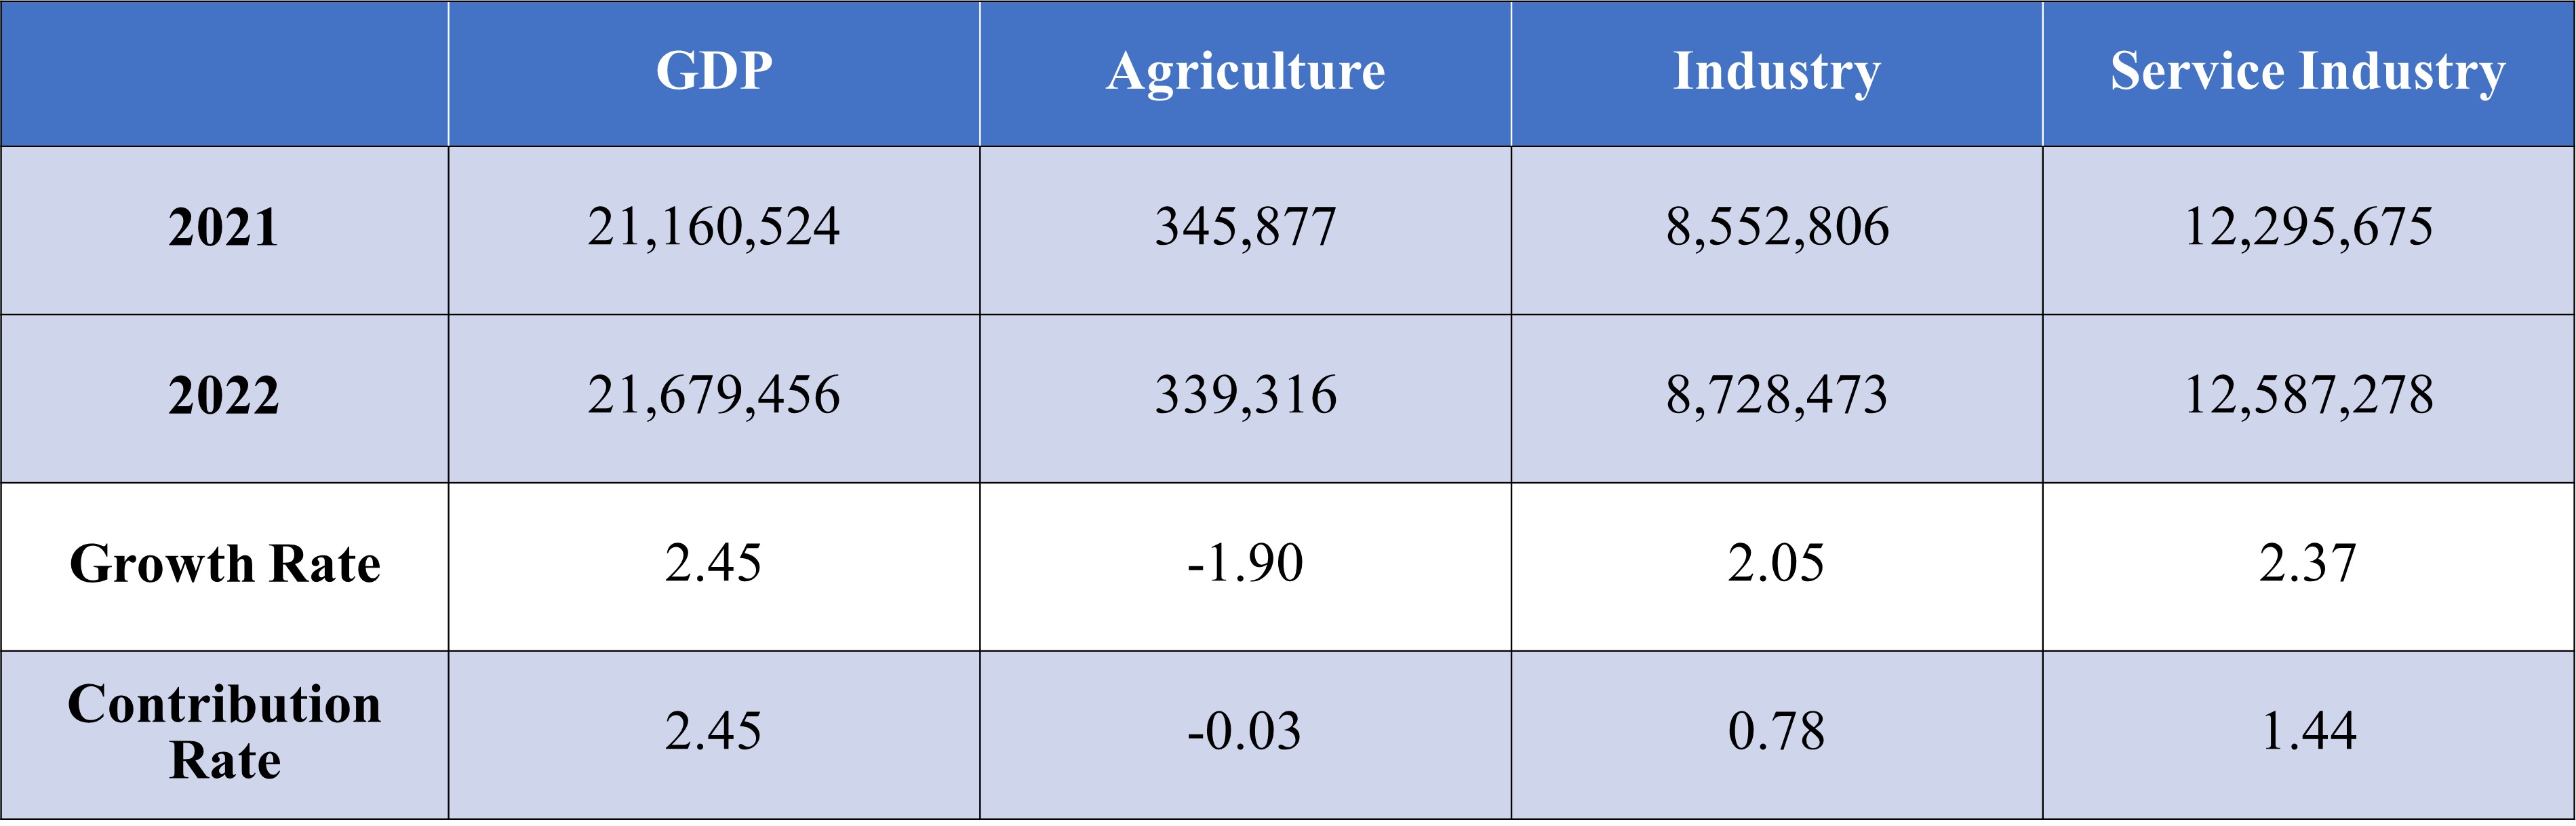
Source: Directorate-General of Budget, Accounting and Statistics, Executive Yuan, and the Business Cycle Forecasting Team of CDRI
2. Service industry business cycle outlook
【Regarding the indicator system】
The business cycle Composite Index system on the Time Series Analysis. We analyze the relevant economic indicators in the time series and select indicators based on their significance to the business cycle and stability of their cyclicality. They are then classified into leading indicators, coincident indicators and lagged indicators through the use of statistical analysis and verification.
The cyclical trend of the Composite Index of coincident indicators is shown to be highly correlated with the cyclical trend of the GDP, and the forecast value of the Composite Index of the coincident indicators, estimated by the Leading Indicator Composite Index, could be used to forecast the moving trends of the GDP.
The cyclical trend of economic indicators fluctuates around the long-term trend. The long-term trend value is normalized to 100; cyclical trend values greater than 100 indicate a recovery or prosperity stage while values below 100 indicate a recession or depression stage.
The standardized changes of the indicators’ cyclical trend values (in Standard Deviation units) are added up to become a Composite Index, and it fluctuates around the long-term trend value with a Standard Deviation of zero.
【Latest Indicator Trends】
The Leading and Coincidental Composite Indices Curve for this business cycle’s indicator system is shown in Figure 2.
Leading Cyclical Composite Index (LCCIS) peaked at 0.8529 Standard Deviations in November 2021 and fell to -1.28 Standard Deviations in January this year.
Looking at the diffusion situations of the leading indicators, only one of the seven sub-indicators, “Transportation and Storage Industry,” is currently on the rise.
The CCCIS has been directly affected by the pandemic, having fallen from its peak of 0.5837 Standard Deviations, in September 2020 to a trough of -0.2591 Standard Deviation in July 2022. Then, as the pandemic eased, it stopped declining and started to rise. As of January this year, it was -0.2466 Standard Deviations, and it’s predicted to rise to -0.2067 Standard Deviations in July this year. (See Figure 1 above and the attached appendix).
As the Composite Index has still not returned to its normal growth trend, and looking at the diffusion of the coincident indicators, three of the five sub-indicators are still declining, in addition to the continuing decline of the Leading Cyclical Composite Index. As a result, the overall economy is still faced with downside risks.
Figure 2. Leading and Coincidental Cyclical Composite Index for the Service Industry
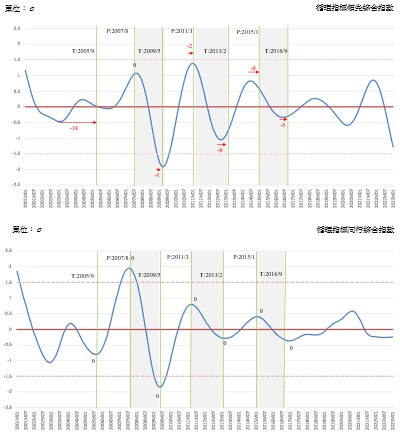
Source: Business Cycle Forecasting Team, CDRI
A. Leading indicator series
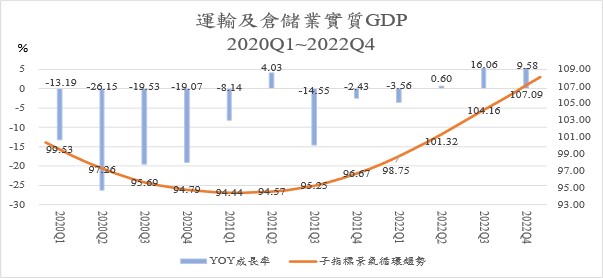
a. “Business cycle trend of real GDP of the Transportation and Storage Industry” has slightly recovered, still being top of the GDP growth momentum.
The cyclical tendency of this sub-indicator has been continuously increasing for 22 months as of January 2023. Its trend began to accelerate in H2 2021, and by April 2022, the cyclical tendency value had exceeded the long-term trend level of 100. In January 2023, it reached 109.04 (standardized to a staggering 3.4 Standard Deviations), indicating a historical level of prosperity.
However, the annual growth rate (YOY), calculated based on its actual value, has turn positive in Q2 last year (2022), with a growth of 0.6%. In Q3, it grew significantly by 16.26%, and it also grew by 9.58% in Q4.
Figure 3. The annual growth rate of Transportation and Storage GDP and business cycle trend, 2020Q1~2022Q4
Source: Business Cycle Forecasting Team, CDRI and Directorate General of Budget, Accounting and Statistics, Executive Yuan
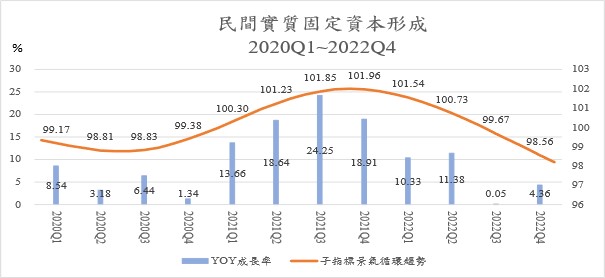
b. “Private Real Fixed Capital Formation” has weakened.
The cyclical tendency of this sub-indicator turned upward in July 2020, when the pandemic was rampant, but it reversed downward in November 2021 and had fallen to 97.82 below the long-term trend value as of January 2023, indicating that the upward momentum of Private Investment is accelerating its weakening. The cyclical trend value, standardized, has also fallen to -0.64 Standard Deviations.
In addition, the year-on-year growth rate (YoY) based on its actual GDP value has remained positive for each quarter since 2020, but it maintained double-digit growth throughout 2021 until Q2 of last year and has since declined to 0.05% and 4.36% in Q3 and Q4 last year, respectively.
Figure 4. Annual growth rate and cyclical trend of Private Real Fixed Capital formation, 2020Q1~2022Q4
Source: Business Cycle Forecasting Team, CDRI and Directorate General of Budget, Accounting and Statistics, Executive Yuan
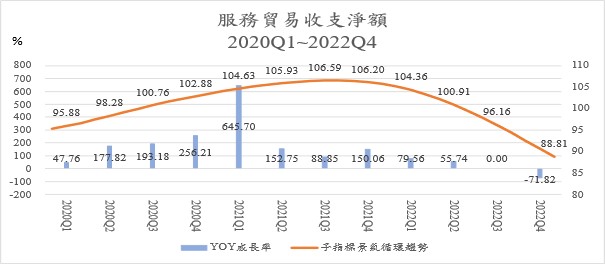
c. “Net Balance of Trade in Services Revenue and Expenditure” shows that the cyclical tendency value has been exceeding its long-term trend value for a long time, however, the surplus has been shrinking rapidly since last year, and there is still much work to be done in transforming the structure of trade in services.
The cyclical tendency of this sub-indicator hit a trough in September 2019 and has been rising steadily ever since. After one year of growth, it reached a peak in September 2021, followed by a slight decline. As of June 2022, the index was below the long-term trend value and was rapidly declining. In January 2023, the cyclical index had dropped to 86.95, and the standardized cyclical trend value was even -3.42 Standard Deviations, indicating significant fluctuations in the business cycle during the pandemic.
Taiwan’s trade in services has historically been in deficit, but the disruption of international travel due to the pandemic in 2020 led to a significant improvement in Taiwan’s net Balance of Trade in services, which became a rare surplus starting from Q2 2020. This surplus increased sharply in 2021 but has since been decreasing quarter by quarter. The most significant item of change during this period has been the external balance for transportation and travel services. From a deficit of 1.848 billion US dollars in Q3 of 2019, it became a surplus of 5.017 billion US dollars in Q1 2022 and then decreased to a surplus of 1.126 billion US dollars in Q4 2022. Transportation changed from a deficit of 259 million US dollars to a surplus of 3.986 billion US dollars and 1.351 billion US dollars, respectively. Travel changed from a deficit of 2.289 billion US dollars to a deficit of 249 million US dollars and a surplus of 62 million US dollars, respectively. By comparing this system’s cyclical trend analysis, it can be preliminarily considered that Taiwan’s long-term deficit structure in trade in services, although reversed by the pandemic’s impact, is still in need of further transformation, indicating the urgent need for digital transformation in developing our service industry.
Looking at its actual GDP value, the net Balance of Trade in services in Q1 2021 even hit a historical high, with a YoY growth rate of 645.7%. However, it dropped to 152.75% in Q2, 88.85% in Q3, and rebounded to 150.1% in Q4. It has since been slowing down continuously in 2022, with zero growth in Q3 and negative growth of 71.82% in Q4, indicating that the rare improvement in Taiwan’s net Balance of Trade in services in history is clearly slowing down.
Figure 5. Annual growth rate and cyclical trend of net trade in Services Revenue and Expenditure, 2020Q1~2022Q4
Source: Business Cycle Forecasting Team, CDRI and Directorate General of Budget, Accounting and Statistics, Executive Yuan
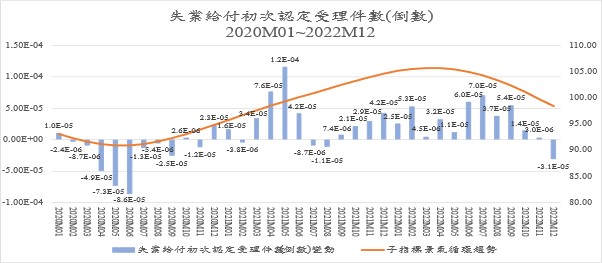
d. “Initial Acceptance of Unemployment Benefits (inverted)” has been continuously decreasing and now shows a trend of increasing, indicating that the unemployment pressure, which had previously been easing, is on the rise again.
The cyclical tendency of this sub-indicator reached its lowest value of 91.07 in June 2020, and then rose all the way, and then rose steadily to a peak in March 2022 (with a cycle trend value as high as 105.7), indicating that the number of people applying for unemployment benefits for the first time, a leading indicator of the unemployment rate, had significantly decreased during the pandemic, and the unemployment pressure had continued to ease. However, the downward trend over the past ten months has shown a shift in the job market, with the unemployment pressure quietly rising again (the cycle trend value for January 2023 decreased to 97, showing a standardized Standard Deviation of -0.24.)
Figure 6. Number of the initial acceptance of unemployment benefits (inverted) and the annual growth rate and cyclical trend January 2020 to December 2022
Source: Business Cycle Forecasting Team, CDRI and Directorate General of Budget, Accounting and Statistics, Executive Yuan
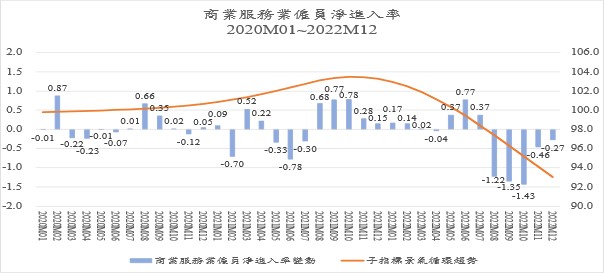
e. “Net Entry Rate of Employees in the Commercial Services Industry” continues to decline, indicating a roadblock in employment expansion.
The cyclical tendency of this sub-indicator reached a trough of 99.35 in May 2019, then steadily increased to a peak of 103.47 in October 2021. The cyclical trend index, which shifted from rising to falling, has been below the long-term trend since June 2022 and has fallen to 91.97 in January 2023. The standardized cyclical trend also shows a negative deviation of 2.97 Standard Deviations, indicating a severe roadblock in the employment expansion of the Commercial Service Industry. The following chart also shows that the net entry rate of employees has been negative since August 2022.
Figure 7. Annual changes and cyclical trends in the net entry rate of employees in the commercial service industry, January 2020 to December 2022
Source: Business Cycle Forecasting Team, CDRI and Directorate General of Budget, Accounting and Statistics, Executive Yuan
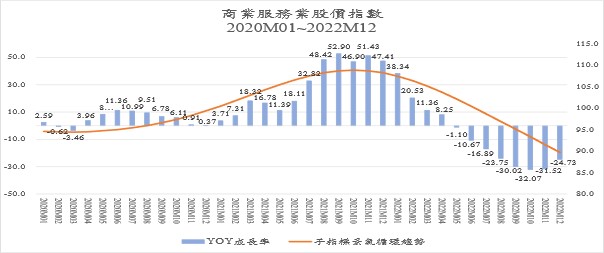
f. “Stock Price Index of the Commercial Services Sector” has stopped rising and turned downward, with the downward trend continuing to expand.
The cyclical tendency of this sub-indicator started from the bottom of March 2020, with an index of 94.47, and continued to rise to the peak of October 2021, reaching 108.88. This reflected the prosperous trend of the general stock market in Taiwan for the past year and a half. However, due to the lack of follow-up, it started to decline after reaching the peak, and has continued to decline until January 2023, with an index of 87.98. The standardized cyclical trend also shows a serious negative deviation of 2.24 Standard Deviations, indicating that the Commercial Service Industry stock market has been clearly accelerating its downward trend since last year.
An indicator is the annual growth rate of the actual Stock Price Index. It has seen double-digit growth since March 2021 and even reached 32.82% and 48.42% in July and August, respectively. In September and October, the growth rate came to 52.9% and 46.9%, and 51.43% and 47.41% in November and December. However, it then declined since last year, with negative growth since May 2022, and the decline continued to expand. The decline in September even exceeded 30%. The annual growth rate in October was -32.01%, followed by -31.52% in November, and -24.73% in December.
Figure 8. The annual growth rate and circular trend of the Stock Price Index of the commercial service industry, January 2020 to December 2022
Source: Business Cycle Forecasting Team, CDRI and Directorate General of Budget, Accounting and Statistics, Executive Yuan
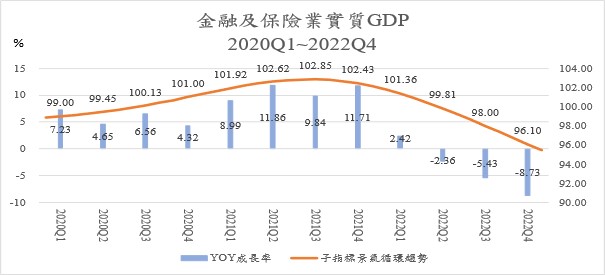
g. Cyclical trend of “Real GDP of Finance and Insurance Sector” continues to decline, and the actual value of negative growth rate is accelerating.
The cyclical tendency of this sub-indicator gradually recovered in H2 2019, and the business cycle index began to return to the long-term trend value (100) in August 2020, reaching 100.14. It continued to rise slightly but peaked at 102.85 in August 2021 and then turned downward, with the decline rate gradually accelerating. After 17 months, it had dropped to 94.83 in January 2023, and the standardized cyclical trend value showed -3.45 Standard Deviations, indicating a poor economic situation.
Also, looking at the annual growth rate (YOY), contrary to the continuous acceleration in 2020 and 2021, it turned negative starting in Q2 last year, and the rate of slowdown has been accelerating. The growth rate was -2.36% in Q2, -5.43% in Q3, and -8.73% in Q4.
Figure 9. Annual growth rate and cyclical trend of real GDP of Finance and Insurance Sector, 2020Q1~2022Q4
Source: Business Cycle Forecasting Team, CDRI and Directorate General of Budget, Accounting and Statistics, Executive Yuan
B. Coincident indicator series
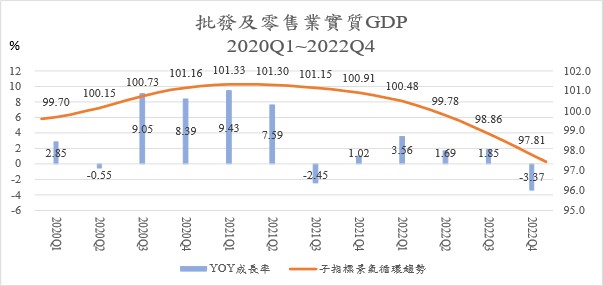
a. The business cycle trend of “Real GDP Index of Wholesale and Retail” continues to fluctuate downwards, and the actual growth rate has turned from positive to negative.
The cyclical tendency of this sub-indicator hit a bottom of 99.45 in August 2019 and reached a peak of 101.34 in March 2021. It has been declining ever since and reached 97.09 in January 2023 after 22 months. The standardized cyclic trend value has dropped even further to -3.01 Standard Deviations, indicating a more pronounced decelerating trend in H2 last year.
Meanwhile, the actual annual growth has shown growth from H1 last year (2021), but after the first negative growth fluctuation in Q3 (growth rate of -2.45%), it has been sluggish and unresponsive, with another -3.37% in Q4 last year.
Figure 10. Annual growth rate and cyclical trend of real GDP Index of Wholesale and Retail, 2020Q1~2022Q4
Source: Business Cycle Forecasting Team, CDRI and Directorate General of Budget, Accounting and Statistics, Executive Yuan
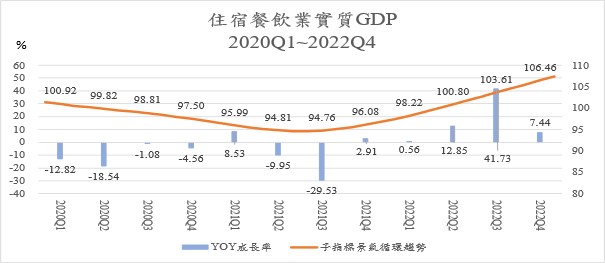
b. “Real GDP of the Accommodation and Catering Industry” bottoms out in Q3 2021 and is continuing to accelerate.
The industry has been greatly impacted by the pandemic with the cyclical tendency of this sub-indicator peaking in May 2019 at 103.65, and then falling ever since. It hit a trough with 94.61 in July 2021, Subsequently, it has rebounded to 108.33 in January 2023. The standardized cyclic trend value has also rebounded from a bottom of -2.68 Standard Deviations to +4.14 Standard Deviations, indicating a significant post-pandemic strong recovery in the economy.
The actual annual growth has been going down all the way since the growth of 8.53% in Q1 2021. -9.95% in Q2, and -29.53% in Q3. Q4 and Q1 last year increased slightly by 2.91% and 0.56% respectively. It wasn’t until Q2 and Q3 this year that they rose rapidly, with growth rates as high as 12.85% and 41.73% respectively. The growth rate grew higher to 7.44%.
Figure 11. The annual growth rate and circular trend of real GDP in the Accommodation and Catering Industry, 2020Q1~2022Q4
Source: Business Cycle Forecasting Team, CDRI and Directorate General of Budget, Accounting and Statistics, Executive Yuan
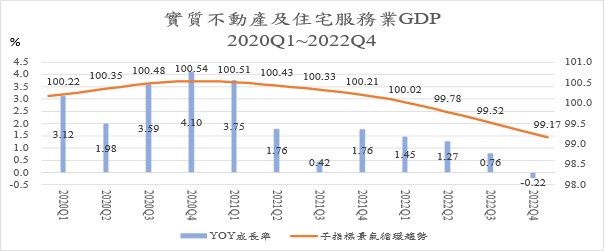
c. “Real GDP of Real Estate and Residential Service Industry” business cycle trend continues to slow down, and the actual value saw its first negative growth in Q4 2022.
The cyclical tendency of this sub-indicator fluctuates slightly over the long-term. The index peaked in December 2020, with a value of 100.54 and then slightly decline. It was lower than the long-term trend (100) by March 2022 and continued to decline with a value of 99.08 in January this year. The standardized cyclic trend value also shows -1.52 Standard Deviations.
The actual annual growth rate has shown a continuing growth; however, it has slowed down since Q2 2021, with Q4 last year seeing the first negative growth rate at -0.22%.
Figure 12. Annual GDP growth rate and cyclical tendency of Real Estate and Residential Service Industry, 2020Q1~2022Q4
Source: Business Cycle Forecasting Team, CDRI and Directorate General of Budget, Accounting and Statistics, Executive Yuan
d. “Residential Services, Utilities, and Other Fuel Industries” continues to grow slightly while the business cycle trend turns downwards sine Q3 2021.
The cyclical tendency of this sub-indicator showed little long-term fluctuation. It reached the bottom in April 2019, with an value of 99.77, and then kept rising slightly before reaching its peak of 100.18 in May 2021. It then declined all the way until January this year at 99.81. The standardized cyclical trend value has also decreased from +1.17 Standard Deviations at its peak to -1.26 Standard Deviations.
Looking at the annual growth rate, positive growth has been observed in every quarter since 2020, but the magnitude of the fluctuations has been small. The highest annual growth rate during the pandemic was 2.58% in Q2 2020, while the lowest was 0.91% in Q2 2022. Q3 and Q4 2022 were 1.44% and 1.29%, respectively.
Figure 13. Real Consumption of Residential Services, Utilities, and Other Fuel Industries, 2020Q1~2022Q4

Source: Business Cycle Forecasting Team, CDRI and Directorate General of Budget, Accounting and Statistics, Executive Yuan
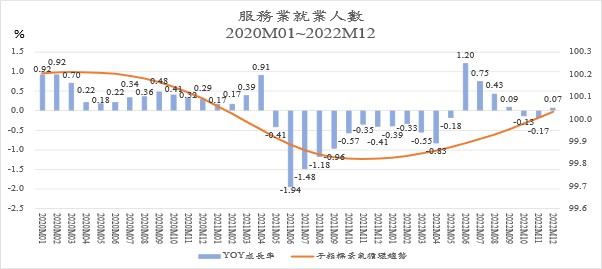
e. The cyclical trend of “Number of employees in the Service Industry” continues to show a slight upward trend.
The cyclical tendency of this sub-indicator reached its peak in March 2020 when the COVID-19 pandemic began, with an index of 100.21. It then declined continuously, falling below the long-term trend value in March 2021 (with an index of 99.98) and reaching its bottom in November of the same year, with an index of 99.82. The decline during this period was very small, and the subsequent increase after hitting the bottom was also very limited. Finally, in November 2022, it returned to the long-term trend value with an index of 100.01, and in January 2023, it continued to rise slightly to an index of 100.06. The standardized cyclical trend value increased from -1.28 Standard Deviations at the bottom in 2021 to +0.43 Standard Deviations in January 2023.
Looking at the annual growth rate, it was positive from January 2020 to April 2021, but the growth was very limited, with the highest monthly growth rate not exceeding 1%. From May 2021 to May 2022, the growth rate was negative, and the reduction in Q2 and Q3 of 2021 was significantly larger, clearly due to the impact of the pandemic and the recession on labor demand. Growth turned positive from June 2022, but the growth rate remained limited, with an average growth rate of only 0.62% from June to September, and the growth rate slowed down month by month, with a growth rate of only 0.09% in September. The average annual growth rate for each month in Q4 2022 was -0.08%, but it was not enough to affect the upward trend of the business cycle.
Figure 14. The growth rate and cyclical tendency of The Number of Employees in the Service Industry, January 2020 to December 2022
Source: Business Cycle Forecasting Team, CDRI and Directorate General of Budget, Accounting and Statistics, Executive Yuan
C. Lagged indicator series
The lagged indicator includes Real Consumption of Tobacco and Alcohol, Real Consumption of Clothing, Footwear, and Apparel, Real Consumption of Furniture, Equipment, and Housekeeping, and the Number of Initial Recognition and Acceptance of Unemployment Benefits. The Lagged Index can be used as a reference for observing whether a business cycle is over. This article omits relevant analysis.
Appendix
Business Cycle Coincident Composite Index for Taiwan Service Sector
|
Year/Month
|
Deviation of Standardized Cyclical Coincident Composite Index
(Unit: σ, Benchmark: 0)
|
Remark
|
|
2023-07
|
-0.2067
|
(P)
|
Use ARMA Model: (4,0)(0,0) to make predictions based on the leading effect set for half year
|
|
2023-06
|
-0.2169
|
(P)
|
|
2023-05
|
-0.2254
|
(P)
|
|
2023-04
|
-0.2323
|
(P)
|
|
2023-03
|
-0.2380
|
(P)
|
|
2023-02
|
-0.2426
|
(P)
|
|
2023-01
|
-0.2466
|
(f)
|
The estimated value of the Coincident Composite Index
|
|
2022-12
|
-0.2500
|
(a)
|
The actual value of the Coincident Composite Index
|
|
2022-11
|
-0.2529
|
(a)
|
|
2022-10
|
-0.2552
|
(a)
|
|
Source: Business Cycle Forecasting Team, CDRI
Note: (a): actual; (f): estimated; (p): predicted
|