Authors: Tain-Tsair Hsu(許添財), Shin-Hsien Chen(陳世憲)
【Abstract】
The CDRI business cycle indicator shows that Coincidental Cyclical Composite Index for Service Industry (CCCIS) in July 2023 indicated a continuous recovery since July 2022, with an accelerating trend. The continued rise of CCCIS is still attributed to the ongoing rising and accelerating in both of the indicators of “the Real GDP of the Accommodation and Catering Industry” and “the Employment of the Service Industry”. Among the other sub-indicators, both Wholesale and Retail Industry as well as Real Estate and Residential Service Industry still show declines; however, the downward trends have noticeably slowed down.
As for Leading Cyclical Composite Index (LCCIS), it continues to decline, but the pace of decline has eased. The reason is that the number of sub-indicators showing an upward trend has increased to two, namely the real GDP of the Transportation and Storage Industry and the Net Entry Rate of Employees in the Commercial Services Industry, and with both experiencing strengthened upward momentum. Furthermore, among the remaining five sub-indicators with a downward cyclic trend, the downward trend of three indicators are slowing down, namely the Number of Initial Acceptance of Unemployment Benefits (inverted), the Stock Price Index of the Commercial Service Industry, and the Real GDP of Finance and Insurance Sector; and the downward trends of the other two indicators are sharpening, namely the Private Real Fixed Capital Formation, and the Net Balance of Trade in Services Revenue and Expenditure, have intensified.
Here’s the summary of some key points regarding the changes in Business Forecast for Taiwan’s Commercial Service Industry in Q3 2023:
1. The cyclical trends of various sector indicators have been fluctuating, showing an “divergent”, “uneven” recovery phenomenon between sectors.
2. Upon further examination of the sub-indicators showing upward cyclic trends, either belonging to Leading or Coincident indicator, all gain momentum as they rise. Additionally, for the sub-indicators displaying declining trends, either Leading or Coincident, their pace of decline is slowing down. All in all, chances for the whole economy of Taiwan to get a more broad-based recovery are rising. However, there are some downsides lies in the Leading indicators, specifically in the Private Investment Sector and the Services Trade Sector. The downward trends of these two indicators have been getting sharpening. It could become the most significant uncertainty for the overall economic recovery.
3. In terms of changes in growth trends by sector, whether from the expenditure side or the production side, whether in actual values or cyclical trend values, the shift in momentum from external demand to domestic demand and from production to consumption is clear. This “uneven economic recovery “hot inside and cold outside” and “strong consumption and weak production,” shows a special structural transformation, which could be only a short-term phenomenon. Due to the limited size of domestic market and finite resources we have, no matter how this growth model develops, it will be limited and fall into a long-term “low-level equilibrium” finally. Moreover, once investments come to a halt, it will have a negative impact on our international competitiveness and the enhancement of productivity. This, in turn, will affect the development of foreign trade and our consumption capacity, potentially leading to a vicious cycle.
4. The return of the Net Balance of Trade in Services Revenue and Expenditure to its previous long-term deficit pattern has created a further reliance on a surplus in the international balance of payments from the export of goods. This exposes a structural weakness where we can’t see breakthroughs in innovative business models for digital trade and the growth of service exports in the digital economy era. The concern is not only the deficit in services trade itself but, more critically, our inability to catch up in the new environment of international trade market transformation, displacement, and changing consumer behavior.
5. The cyclical trends of two indicators, the Net Entry Rate of Employees in the Commercial Service Industry, and the Number of Employees in the Service Industry, are on the rise with growing momentum. This suggests a stronger demand for labor in the Commercial Services Industry. Looking ahead, the improving and strengthening cyclical trends in Accommodation and Catering Industry, as well as Transportation and Storage Industry, coupled with the observed slowdown in the declining cyclical trend of the Wholesale and Retail Industry, will make it challenging to address the current labor shortage issues in the Service Industry.
Moreover, the post-pandemic labor supply-demand imbalance has its roots in both long-term and short-term structural factors. For remote cause, it’s driven by a diminishing labor force due to declining birth rates and an aging population. While for the proximate cause, it’s influenced by pandemic-induced changes in employment patterns, with the gig economy and delivery platforms absorbing a significant portion of traditional labor supply. Additionally, the post-pandemic surge in the number of Accommodations and Catering Industry establishments has led to a shortage of marginal skilled workers in the industry. Without implementing reforms on the industry’s supply side and extending reforms to the labor demand side through innovations such as Digitization, Digital optimization, Digital transformation, automation, and human-machine collaboration to reduce labor usage and enhance the productivity, the labor shortage issue can’t be solved fundamentally. Especially in the future, as the Manufacturing Industry undergoes a recovery, but while if digital manufacturing and transformation in the industry can’t keep pace with advancements, the current situation for competing for marginal skilled labor between sectors will further become even more critical.
1. Comprehensive analysis and prediction
CDRI finds that the Coincidental Cyclical Composite Index for Service Industry (CCCIS) has bottom out in June 2022 of -0.6178 Standard Deviation. However, as of July 2023, the index has steadily risen to a positive value of 0.9362 Standard Deviations. It’s predicted that the index will continue to steadily increase and reach 1.8237 Standard Deviation by January 2024. (See Figure 1 and the appendix below)
Figure 1. “Tendencies and Forecasts of the Coincidental Cyclical Composite Index for the Service Industry”
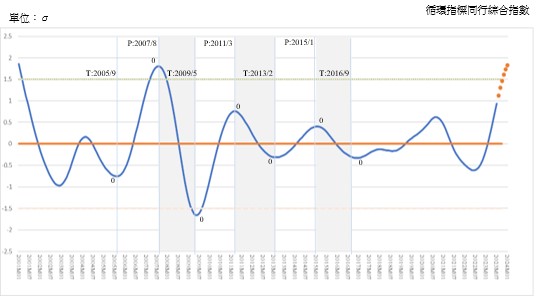
Source: Business Cycle Forecasting Team, CDRI
Based on the data provided by the Directorate General of Budget, Accounting and Statistics, Executive Yuan, the economic growth rate for H1 this year (2023) has declined to -0.98%. The primary shift in economic growth momentum has been from external demand to domestic demand and from investment to consumption. Due to the limited size of the domestic market and resource constraints, if this structure persists, it is inevitable that the economy will remain in a state of “low-level equilibrium”. Therefore, it is essential to await a turning point or stimulate policy changes to break free from this situation.
From the perspective of GDP expenditure, the growth rate contribution of Private Investment has shifted from positive to negative, with a growth rate of -8.09% and a contribution of -1.85%. This is in line with the concurrent growth rate of Net Exports, which stands at -19.28%, contributing -8.05%, making it also one of the most severely affected sectors during the decline. Additionally, there is the growth rate of inventory changes, which is at -162.3% and contributes -1.04%.
Private Consumption, which had the weakest growth contribution rate in the past, has not only reversed its growth rate but also emerged to the top position in terms of growth rate contribution, with a growth rate of 9.4% and a contribution of 4.23% during the same period.
There is a clear trend that the main momentum for economic growth has shifted from external demand to domestic demand. Apart from significant growth and contribution from Private Consumption, during the same period, Government Consumption has a growth rate of 2.68% and a contribution of 0.33%; Government Investment has a growth rate of 5.65% and a contribution of 0.12%; and Government-Operated Enterprise Investment has a growth rate of 16.61% and a contribution of 0.21%. (See Table 2 below.)
From the perspective of industry, the growth rate contribution in H1 2023 has also undergone major changes. The growth rate and contribution of the Service Industry have surpassed that of the Industry. The Service Industry has a growth rate of 3.36% and a contribution of 1.96%, while the Industry has a growth rate of -10.27% and a contribution of -4.13%. The overall economic decline is mainly attributed to a substantial decline in the Industry, with only a marginal growth in the Service Industry.
Table 2. H1 2023 economic growth rate and growth contribution rate, by sector
Unit: Millions of New Taiwan Dollars; %
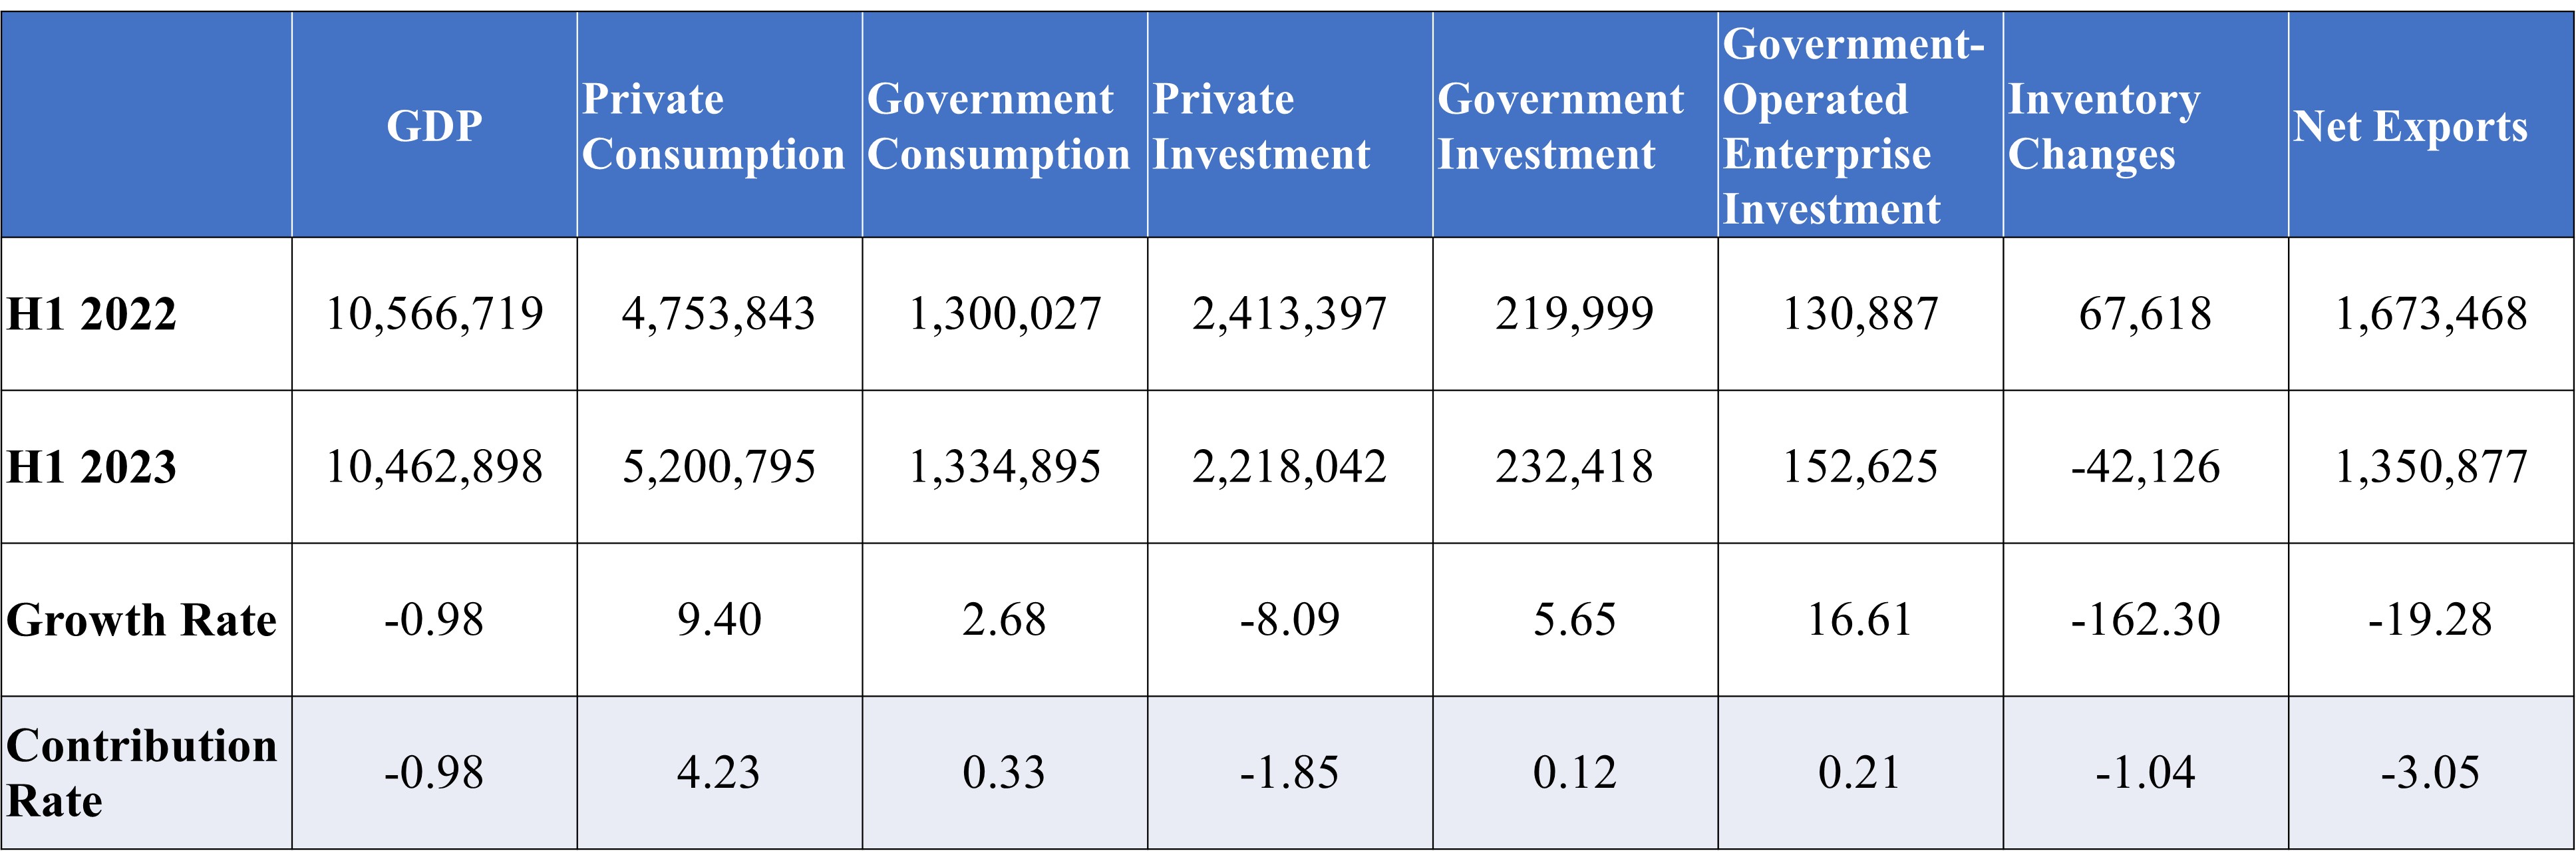
Source: Directorate-General of Budget, Accounting and Statistics, Executive Yuan, and the Business Cycle Forecasting Team of CDRI
Table 3. H1 2023 economic growth rate and growth contribution rate, by industry
Unit: Millions of New Taiwan Dollars; %
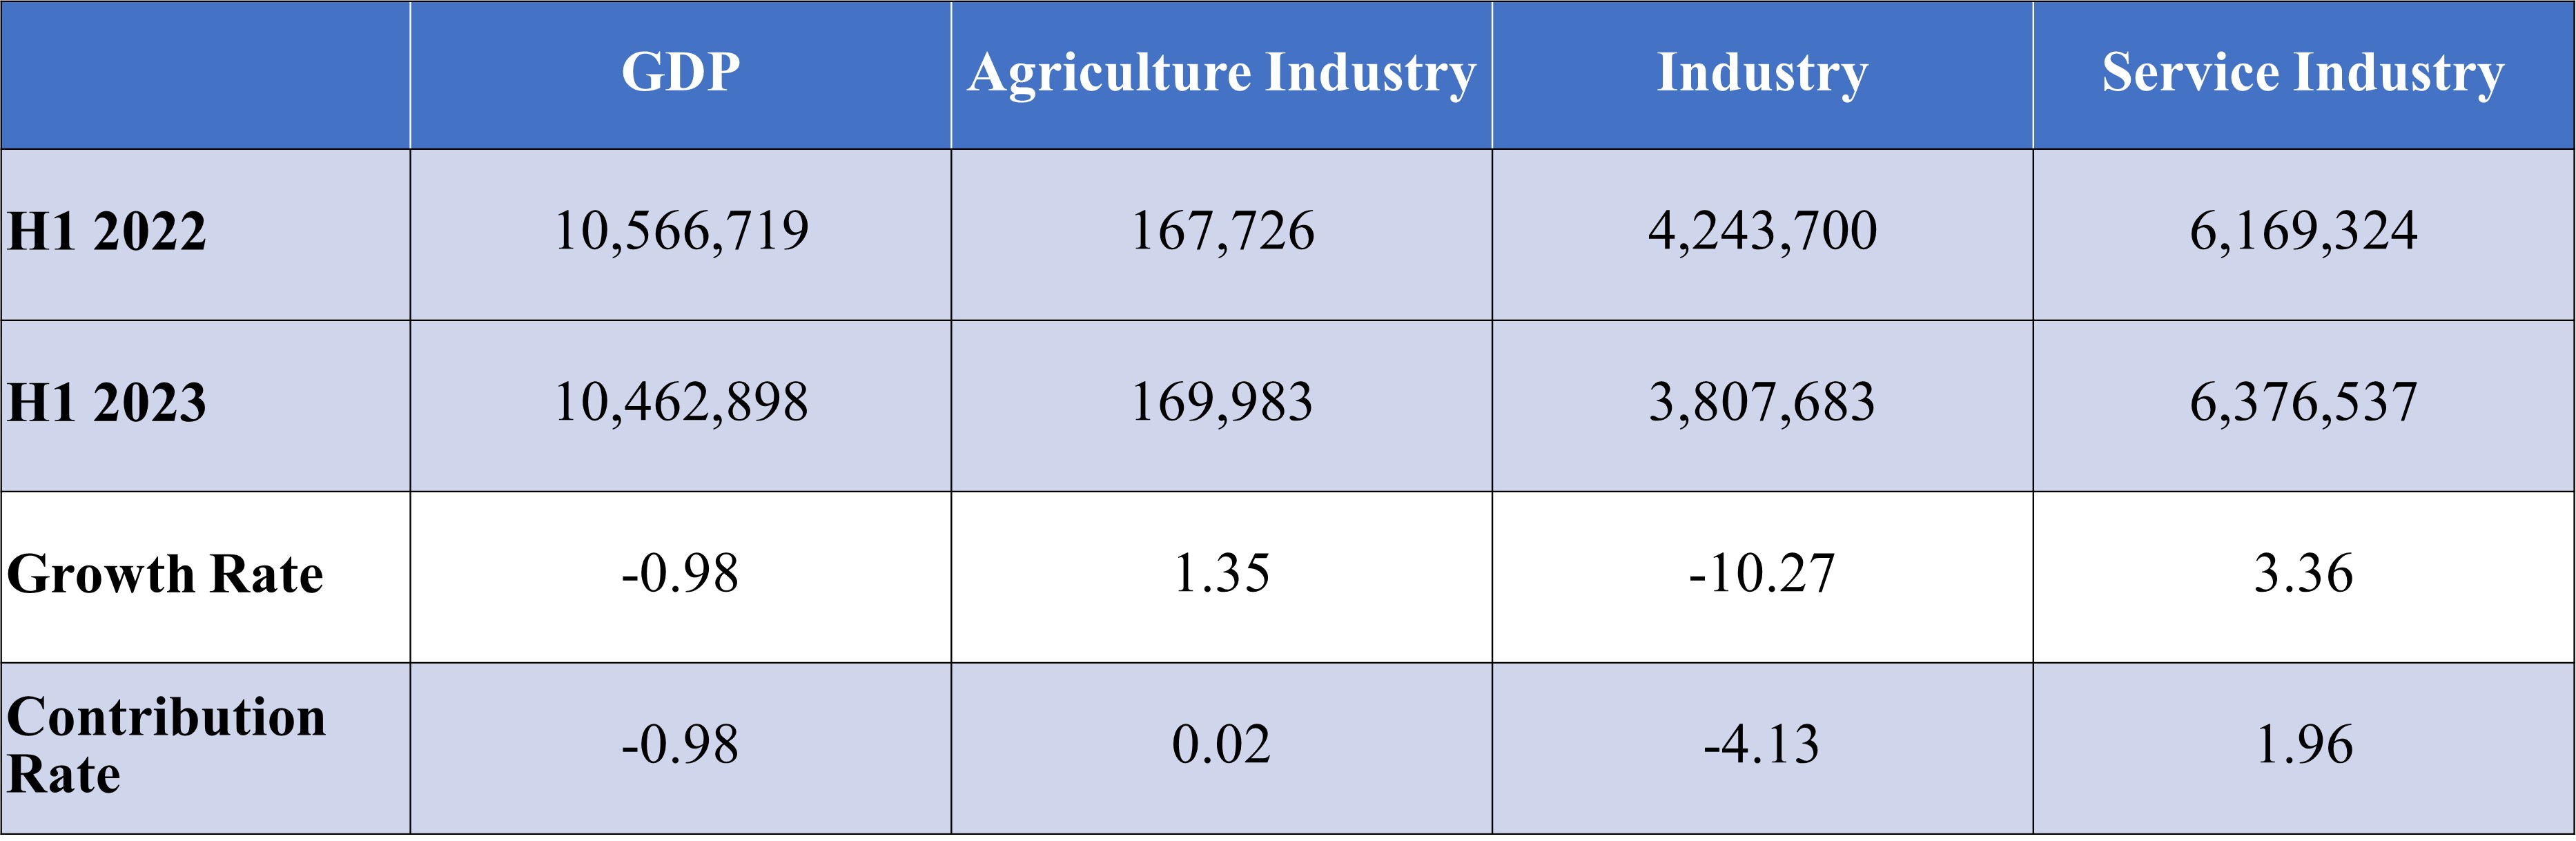
Source: Directorate-General of Budget, Accounting and Statistics, Executive Yuan, and the Business Cycle Forecasting Team of CDRI
Upon further examination of different sectors and industries, it is found that Private Enterprises have been suffering a severe decline in Investment, Manufacturing, and Exports, while Private Consumption of products and services is relatively prospering, resulting in a severe imbalance.
2. Service industry business cycle outlook
【Regarding the indicator system】
The business cycle Composite Index system on the Time Series Analysis. We analyze the relevant economic indicators in the time series and select indicators based on their significance to the business cycle and stability of their cyclicality. They are then classified into leading indicators, coincident indicators and lagged indicators through the use of statistical analysis and verification.
The cyclical trend of the Composite Index of coincident indicators is shown to be highly correlated with the cyclical trend of the GDP, and the forecast value of the Composite Index of the coincident indicators, estimated by the Leading Indicator Composite Index, could be used to forecast the moving trends of the GDP.
The cyclical trend of economic indicators fluctuates around the long-term trend. The long-term trend value is normalized to 100; cyclical trend values greater than 100 indicate a recovery or prosperity stage while values below 100 indicate a recession or depression stage.
The standardized changes of the indicators’ cyclical trend values (in Standard Deviation units) are added up to become a Composite Index, and it fluctuates around the long-term trend value with a Standard Deviation of zero.
【Latest Indicator Trends】
The Leading and Coincidental Composite Indices Curve for this business cycle’s indicator system is shown in Figure 2.
Leading Cyclical Composite Index (LCCIS) has dropped from its peak of 0.8634 Standard Deviations in November 2021 to -0.8722 Standard Deviations in July of the current year (2023). However, the rate of decline has continued to slow down significantly since this year.
Looking at the diffusion situations of the leading indicators, only one of the seven sub-indicators, “the real GDP Indicator of the Transportation and Storage Industry,” is on the rise, compared to the previous quarter. In Q2 this year, the Net Entry Rate of Employees in the Commercial Services Industry has also shown an increase, and both indicators are now on an upward trend that is accelerating.
The CCCIS has been directly affected by the pandemic, having fallen from its peak of 0.6224 Standard Deviations in September 2020, and turned negative starting in June 2021, reaching its lowest of -0.6178 Standard Deviations in June 2022. It then began to recover and reached a positive value of 0.0120 Standard Deviations in February of the current year (2023) and continued to rise to 0.9362 Standard Deviations in July. It is predicted to continue rising to a positive value of 1.8237 Standard Deviations by January 2024. However, the upward trend will weaken by then. (See Figure 1 above and the attached appendix)
Furthermore, when observing the diffusion of the coincident indicators, three of the five sub-indicators are still declining. Only the sub-indicators of the Accommodation and Catering Industry and Number of employees in the Service Industry continue to rise, showing a relatively strong upward trend. This has contributed to the overall increase in the Coincidental Cyclical Composite Index for the Service Industry, presenting another type of uneven post-pandemic recovery phenomenon. Out of the three sub-indicators with continuous declines in their trends, the downward trend of Wholesale and Retail, as well as the GDP of Real Estate and Residential Services Industry, has significantly slowed down. Sub-indicators showing an upward trend are accelerating, while those on the decline are decelerating, indicating that the economic recovery can proceed more steadily.
Figure 2. Leading and Coincidental Cyclical Composite Index for the Service Industry
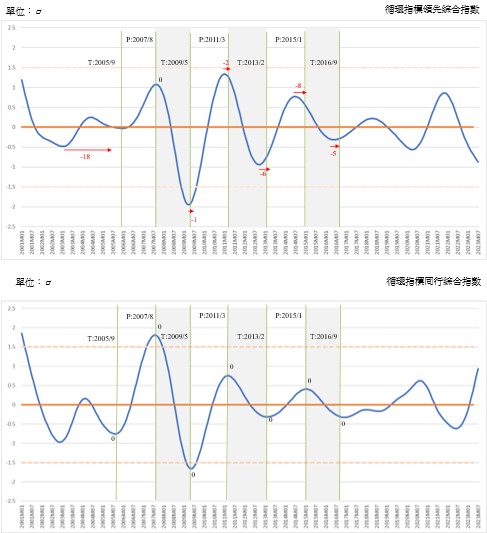
Source: Business Cycle Forecasting Team, CDRI
A. Leading indicator series
a. Business cycle trend of real GDP of the Transportation and Storage Industry continues to rise, growth momentum strengthens, and recovery becomes more robust.
The cyclical tendency of this sub-indicator reached its lowest point in September 2021, with a value of 92.7. It then steadily rose, surpassing the long-term trend value of 100 in October last year (2022). The momentum continued to strengthen, and as of July 2023, the index has reached a high of 114.8 (once being standardized, it’ll reach a positive 5.0303 Standard Deviations), indicating a very strong economic recovery.
However, the annual growth rate (YOY), calculated based on its actual value, has turned from negative to positive in Q2 2022, the fluctuation of the growth rate has increased, reaching 25.27% and 35.83% in H1 this year (2023), respectively, indicating economic vigor.
Figure 3. The annual growth rate of Transportation and Storage GDP and business cycle trend, 2020Q1~2023Q2
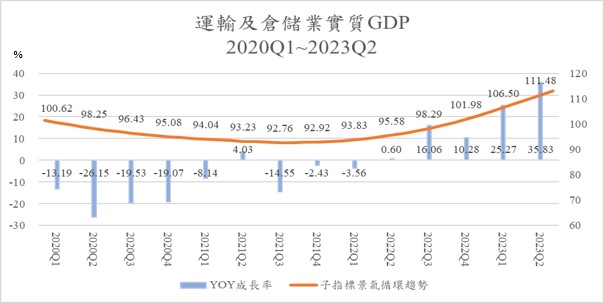
Source: Business Cycle Forecasting Team, CDRI and Directorate General of Budget, Accounting and Statistics, Executive Yuan
b. After a continuous slowdown in the trend of Private Real Fixed Capital Formation for 18 months, the actual values have shown negative growth in H1 this year.
The cyclical tendency of this sub-indicator reached its peak in January 2022, with an index of 104.1, and declined all the way. In November 2022, the index fell below the long-term trend value. In July 2023, it has fallen to 92.2. It’s worth noting that the fervor of Private Investment once driven by the return of Taiwanese businesses is now significantly cooling down.
In addition, the year-on-year growth rate (YoY) based on its actual GDP value has remained positive for each quarter from 2020 to 2022. In Q3 2021, it reached a peak growth rate of 24.25%, but it has been gradually slowing down. In Q3 2022, it was only 0.05%. While there was a 3.96% increase in Q4, H1 this year (2023) have seen consecutive declines of 4.84% and 11.32%, respectively. The halt in Private Investment is evidently unfavorable for future economic growth.
Figure 4. Annual growth rate and cyclical trend of Private Real Fixed Capital formation, 2020Q1~2023Q2
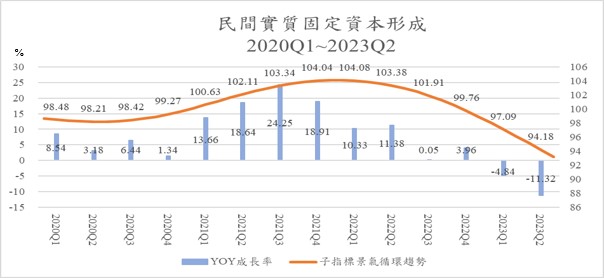
Source: Business Cycle Forecasting Team, CDRI and Directorate General of Budget, Accounting and Statistics, Executive Yuan
c. During the pandemic, there was an unusually rare surplus in “Net Balance of Trade in Services Revenue and Expenditure”. However, currently, its economic trend has turned consistently downward after the pandemic, clearly returning to the historical norm of a trade deficit structure.
Looking at its actual GDP value, Taiwan’s service industry, which had enjoyed a rare trade surplus since Q2 2020, has encountered a reversal after 11 quarters. In Q1 this year (2023), it has reemerged as a trade deficit, amounting to $1.698 billion USD, and in Q2, this deficit expanded further to $2.478 billion USD. The total trade deficit in the Service Industry for H1 this year reached a significant $4.176 billion USD, equivalent to 14.34% of the total trade surplus in goods during the same period, which was $29.113 billion USD.
The cyclical tendency of this sub-indicator hit a trough in September 2019 and reached a peak in December 2021, followed by a slight decline, and the decline continues to intensify. As of October 2022, the index was below the long-term trend value and was rapidly declining. As of July 2023, it has continued to accelerate its decline, reaching 67.5 (once being standardized, it’ll drop to a negative 5.5290 Standard Deviations). It’s indicated that Taiwan’s trade in services has historically been in deficit, but the disruption of international travel due to the pandemic in 2020 led to a significant improvement in Taiwan’s Net Balance of Trade in services, which became a rare surplus starting from Q2 2020. However, now that the pandemic is finally over and countries are gradually lifting restrictions, international travel is resuming, and Taiwan’s Service Industry trade deficit, driven by long-term structural factors, is once again becoming evident.
Looking at its actual GDP value of the Net Service Trade, it experienced a negative growth of 72.65% in Q4 last year (2022), a negative 135.12% in Q1 this year (2023), and a negative 166.74% in Q2. This clearly indicates an expanding trade deficit.
Figure 5. Annual growth rate and cyclical trend of net trade in Services Revenue and Expenditure, 2020Q1~2023Q2
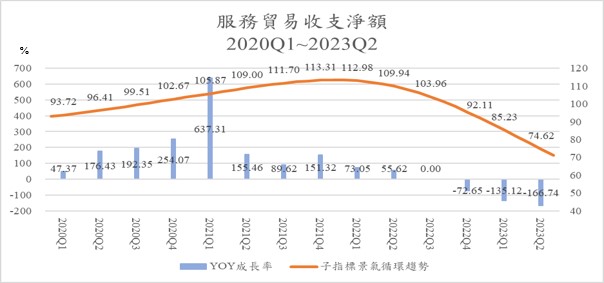
Source: Business Cycle Forecasting Team, CDRI and Directorate General of Budget, Accounting and Statistics, Executive Yuan
d. Initial Acceptance of Unemployment Benefits (inverted) indicates that the economy is not doing well, and overall labor demand pressure has slowed.
The cyclical tendency of this sub-indicator reached its lowest value of 90.3 in May 2020, and then rose all the way, and had exceeded the long-term trend level of 100 in May 2021. It reached 108.7 at its peak in April 2022, indicating a rapid recovery in employment demand. However, it subsequently reversed and started declining. As of July 2023, the inverted Initial Acceptance of Unemployment Benefits stands at 90.5, indicating a slowdown in employment demand. However, it’s worth noting that the Manufacturing and Service Industries are exhibiting an opposite trend of uneven economic situation (both domestically and externally), showing that this indicator, which reflects the overall labor market situation, may not fully represent the conditions in the Commercial Service Industry, particularly in the recovering Accommodation and Catering Industry, which is booming, and the labor shortage situation is still difficult to see immediate relief.
Figure 6. Number of the initial acceptance of unemployment benefits (inverted) and the annual growth rate and cyclical trend January 2020 to July 2023
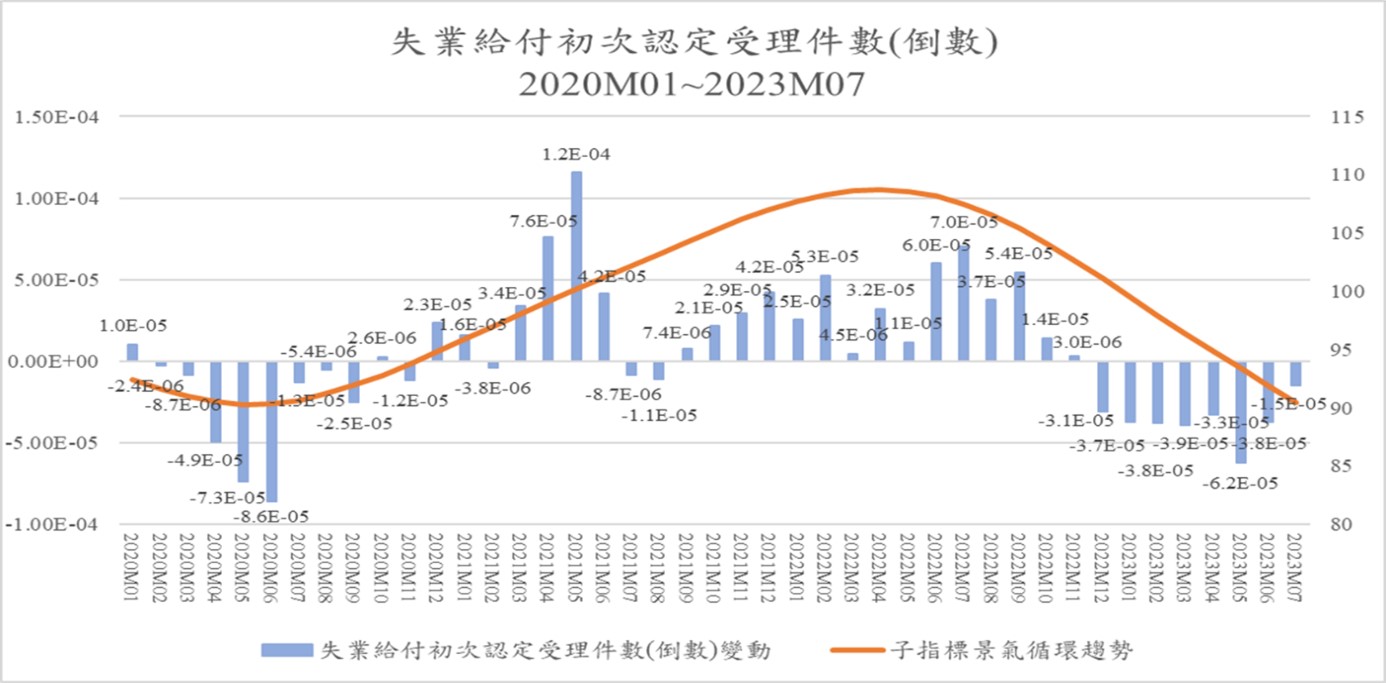
Source: Business Cycle Forecasting Team, CDRI and Directorate General of Budget, Accounting and Statistics, Executive Yuan
e. Net Entry Rate of Employees in the Commercial Services Industry has reached its lowest point in November last year, and now, there is a recovery and expansion in employment demand in the Service Industry.
The cyclical tendency of this sub-indicator reached its peak of 102 in October 2021. The cyclical trend index, then shifted from rising to falling, has been below the long-term trend since May 2022 and hit its lowest point at 98.5 in November 2022. After this reversal and subsequent acceleration in momentum, the cyclical trend index has returned to above the long-term trend value of 100 as of July 2023, standing at 100.3. This indicates that employment in the Commercial Service Industry is expanding once again.
Figure 7. Annual changes and cyclical trends in the net entry rate of Employees in the Commercial Service Industry, January 2020 to June 2023
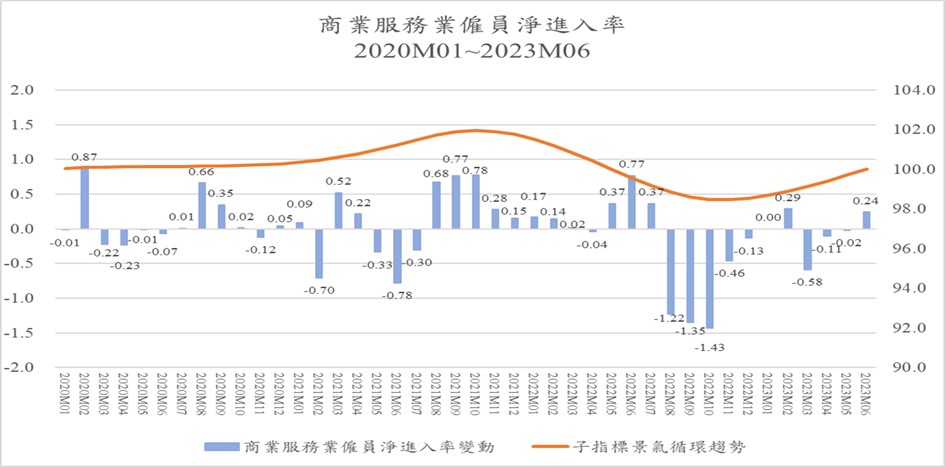
Source: Business Cycle Forecasting Team, CDRI and Directorate General of Budget, Accounting and Statistics, Executive Yuan
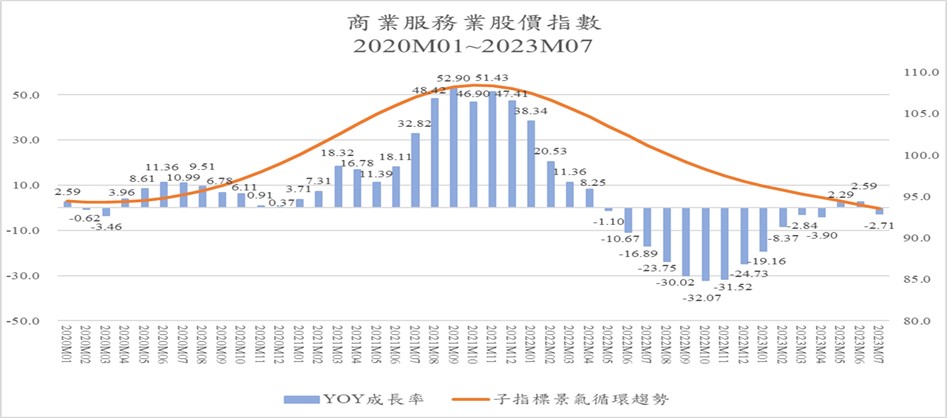
f. Stock Price Index of the Commercial Services Sector has stopped rising and turned downward, significantly impacting economic fluctuations. However, the downward trend has slowed down.
The cyclical tendency of this sub-indicator has reached its peak October 2021, with an index of 108.5. This reflected the prosperous trend of the general stock market in Taiwan for the past year and a half. However, due to the lack of follow-up, it started to decline after reaching the peak, and has continued to decline for 20 months. As of July 2023, it has dropped to 93.6. Nevertheless, the downward trend has slowed down since the end of last year (2022).
An indicator is the annual growth rate of the actual Stock Price Index. It turned negative in May 2022, and the decline continued to expand, with a drop of over 30% in September. In December and January 2023, the decline remained in double digits at -24.7% and -19.2%, respectively. Subsequently, the negative growth rates turned to single digits, with February, March, and April recording -8.4%, -2.84%, and -3.9% respectively. It showed growth in May and June with YOY growth rates of 2.29% and 2.59%, respectively. However, in July, it turned negative with a rate of -2.71%. This indicates that its trend is still experiencing relatively mild fluctuations in a downward direction, and we hope to see a stable recovery soon.
Figure 8. The annual growth rate and circular trend of the Stock Price Index of the commercial service industry, January 2020 to July 2023
Source: Business Cycle Forecasting Team, CDRI and Directorate General of Budget, Accounting and Statistics, Executive Yuan
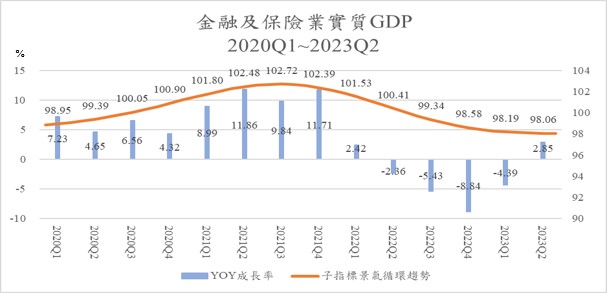
g. The real GDP growth rate in the Finance and Insurance Sector had four consecutive quarters of negative growth, but it turned upward in Q2 this year. While the economic trend is still declining, the rate of decline has significantly slowed down, and there is now some hope of recovery.
The cyclical tendency of this sub-indicator reached its peak at 102.7 in August 2021, and then turned downward, returning to the long-term trend value (100) in July 2020, and keep declining. As of July 2023, it has dropped to 98, indicating an unfavorable economic outlook. However, the downward trend has slowed down significantly.
Also, looking at the annual growth rate (YOY), it turned negative starting in Q2 last year, with a growth rate of -2.36%. In Q3, it further decreased to -5.43%, followed by -8.84% in Q4, and -4.39% in Q1, 2.85 in Q2 this year. This confirms that after a year of continuous decline in the economic trend, there is now a slight hope of recovery.
Figure 9. Annual growth rate and cyclical trend of real GDP of Finance and Insurance Sector, 2020Q1~2023Q2
Source: Business Cycle Forecasting Team, CDRI and Directorate General of Budget, Accounting and Statistics, Executive Yuan
B. Coincident indicator series
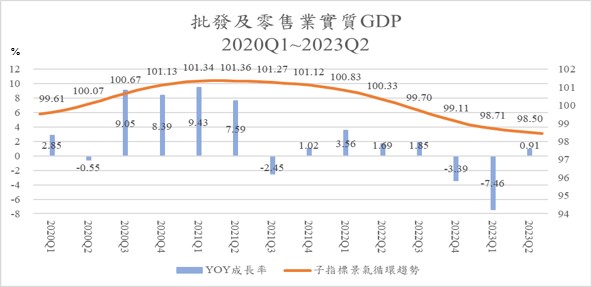
a. The business cycle trend of “Real GDP Index of Wholesale and Retail” was on a downward swing, but it turned positive after two consecutive quarters of negative growth, which is helping with the recovery.
The cyclical tendency of this sub-indicator reached its peak of 101.4 in April 2021. It has been declining since then and fell below the long-term trend value of 100 in July 2022, reaching 98.4 by July 2023. It’s evident that the economic trend has been steadily slowing down since the H2 2021. However, upon closer observation, we can see that this decline significantly slowed in Q2 this year, and we hope for it to hit bottom and start recovering soon.
Meanwhile, looking at the actual values annual growth rate. In Q4 2022, the growth rate turned negative at -3.39%, and in Q1 2023, it further declined to -7.46%. However, in Q2, it turned positive at 0.91%, indicating that there’s hope for a bottoming out and recovery in this industry’s economic recession.
Figure 10. Annual growth rate and cyclical trend of real GDP Index of Wholesale and Retail, 2020Q1~2023Q2
Source: Business Cycle Forecasting Team, CDRI and Directorate General of Budget, Accounting and Statistics, Executive Yuan
b. “Real GDP of the Accommodation and Catering Industry” bottoms out in September 2022 and is continuing to accelerate. The economy is recovering steadily.
The industry has been greatly impacted by the pandemic, but it has also experienced a rapid post-pandemic recovery. The cyclical tendency of this sub-indicator reached the bottom in September 2021, with a value of 93.1. It then continued to accelerate, returning above the long-term trend value of 100 in October last year (2022). As of July this year (2023), the cyclical index has reached as high as 112 (once standardized, it’ll reach a positive 4.81 Standard Deviations), indicating a rapid post-pandemic economic recovery.
The actual annual growth was severely impacted by the pandemic, reaching its lowest point at -29.53% in Q3 2021. It then started to rebound, but the growth rates in each quarter have been fluctuating. In Q3 last year (2022) and Q2 this year (2023), there were exceptionally high growth rates of 41.73% and 37.52%, respectively, indicating that the economic cycle is stabilizing and recovering steadily.
Figure 11. The annual growth rate and circular trend of real GDP in the Accommodation and Catering Industry, 2020Q1~2023Q2
Source: Business Cycle Forecasting Team, CDRI and Directorate General of Budget, Accounting and Statistics, Executive Yuan
c. Real GDP of Real Estate and Residential Service Industry business cycle trend has slowed down significantly.
The cyclical tendency of this sub-indicator fluctuates slightly over the long-term. The index peaked in December 2020, with a value of 100.5. From there, it gradually declined, and in January last year (2022), it started a more pronounced downward trend, falling below the long-term trend of 100 by May and accelerating downward. Since the beginning of this year (2023), the downward trend has noticeably slowed, with the cyclical index standing at 99.5 in July.
The actual annual growth rate reached -0.29% in Q4. In Q1 2023, it was -0.1%. However, it has turned 1.14% in Q2, showing that the downward trend has obviously slowed down.
Figure 12. Annual GDP growth rate and cyclical tendency of Real Estate and Residential Service Industry, 2020Q1~2023Q2
Source: Business Cycle Forecasting Team, CDRI and Directorate General of Budget, Accounting and Statistics, Executive Yuan
d. “Residential Services, Utilities, and Other Fuel Industries” continues to grow slightly while the business cycle trend remains downwards.
The cyclical tendency of this sub-indicator showed little long-term fluctuation. It reached the bottom in July 2021, with a value of 100.2, and then slightly declined all the way. The downward trend has accelerated slightly since this year (2023), and the business cycle index reached 99.7 in July.
Looking at the annual growth rate, growth has been observed in every quarter since 2020, but the magnitude of the fluctuations has been small. The annual growth rate has fluctuated between a high of 2.58% (in Q2 2020) and a low of 0.91% (in Q2 2022). In Q3 2022, there was a growth of 1.44%, followed by a growth of 1.32% in Q4. In Q1 2023, there was a growth of 1.5%, and 1.39% in Q2.
Figure 13. Real Consumption of Residential Services, Utilities, and Other Fuel Industries, 2020Q1~2023Q2
Source: Business Cycle Forecasting Team, CDRI and Directorate General of Budget, Accounting and Statistics, Executive Yuan
e. The cyclical trend of Number of employees in the Service Industry has shown a continuous upward trend in the business cycle, indicating an increase in labor demand. Consequently, the pressure of labor shortages has been on the rise, with no sign of easing.
The business cycle trend of this indicator hit a trough in March last year (2022), with an index of 99.56. After the decline, it gradually started to rise, and by January this year (2023), the trend value exceeded the long-term trend of 100. Furthermore, the momentum has continued to strengthen, with the cyclical index reaching 100.78 in July.
Looking at the annual growth rate, it has been consistently positive since December last year (2022), and the growth rate has been steadily increasing. Starting at 0.07% in December 2022, it has risen to 2.42% in July this year (2023). This reflects an increase in labor demand, which, in turn, has heightened the pressure on employers due to labor shortages.
Figure 14. The growth rate and cyclical tendency of The Number of Employees in the Service Industry, January 2020 to July 2023
Source: Business Cycle Forecasting Team, CDRI and Directorate General of Budget, Accounting and Statistics, Executive Yuan
C. Lagged indicator series
The lagged indicator includes Real Consumption of Tobacco and Alcohol, Real Consumption of Clothing, Footwear, and Apparel, Real Consumption of Furniture, Equipment, and Housekeeping, and the Number of Initial Recognition and Acceptance of Unemployment Benefits. The Lagged Index can be used as a reference for observing whether a business cycle is over. This article omits relevant analysis.
Appendix
Business Cycle Coincident Composite Index for Taiwan Service Sector
|
Year/Month
|
Deviation of Standardized Cyclical Coincident Composite Index
(Unit: σ, Benchmark: 0)
|
Remark
|
|
2024-01
|
1.8237
|
(P)
|
Use ARMA Model: (4,0)(0,0) to make predictions based on the leading effect set for half year
|
|
2023-12
|
1.7296
|
(P)
|
|
2023-11
|
1.6084
|
(P)
|
|
2023-10
|
1.4640
|
(P)
|
|
2023-09
|
1.3008
|
(P)
|
|
2023-08
|
1.1233
|
(P)
|
|
2023-07
|
0.9362
|
(f)
|
The estimated value of the Coincident Composite Index
|
|
2023-06
|
0.7443
|
(a)
|
The actual value of the Coincident Composite Index
|
|
2023-05
|
0.5517
|
(a)
|
|
2023-04
|
0.3625
|
(a)
|
|
Source: Business Cycle Forecasting Team, CDRI
Note:
1. (a): actual; (f): estimated; (p): predicted.
2. The most recent reference cycle turning point: September 2016 (trough).
3. Leading indicator sub-indicators: (1) Real GDP of the Transportation and Storage Industry*, (2) Private Real Fixed Capital Formation*, (3) Net Balance of Trade in Services Revenue and Expenditure*, (4) Initial Acceptance of Unemployment Benefits (inverted), (5) Net Entry Rate of Employees in the Commercial Services Industry, (6) Stock Price Index of the Commercial Service Industry, (7) Real GDP of Finance and Insurance*.
4. Coincident indicator sub-indicators: (1) Real GDP of Wholesale and Retail Industry*, (2) Real GDP of Accommodation and Catering Industry*, (3) Real GDP of Real Estate and Residential Industry*, (4) Real Consumption of Residential Services, Utilities, and Other Fuel Industries*, (5) Number of Employees in the Service Industry.
5. Lagging indicator sub-indicators: (1) Real Consumption of Tobacco and Alcohol*, (2) Real Consumption of Clothing, Footwear, and Accessories*, (3) Real Consumption of Furniture, Equipment, and Household Maintenance*, (4) Initial Acceptance of Unemployment Benefits.
* Indicates that these indicators are calculated based on quarterly data and may require extrapolation due to data limitations.
|